

The BASIC > Dashboard page provides an overview of the performance and health of all of the Barracuda Networks devices connected to Barracuda Cloud Control. In this view, the same traffic and performance statistics available in the BASIC > Dashboard page for your other Barracuda Networks products display. Where there are multiple products of the same type, the statistics are aggregated in one section of the page. To view the traffic and performance statistics of a single device, click on the device name in the Appliance Control Tree in the left panel.
When viewing the Dashboard, the icon in the upper left corner corresponds to the product whose statistics you are viewing.
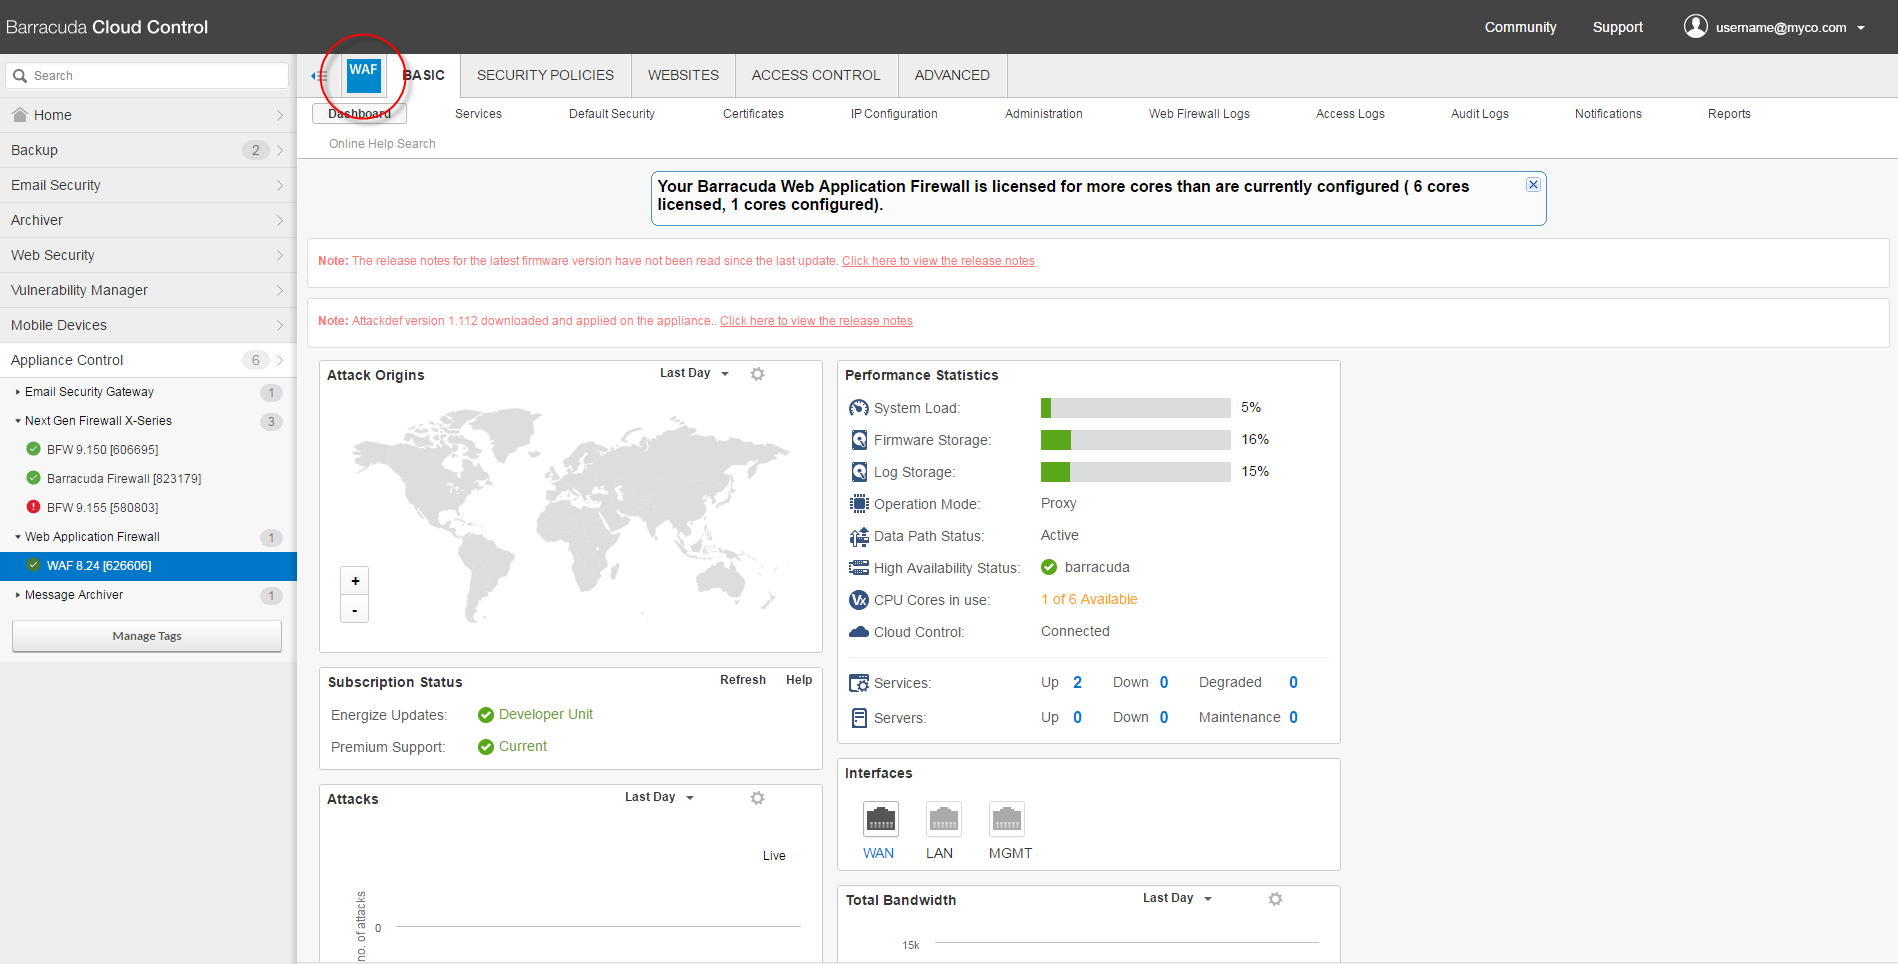
Product Icon for Barracuda Web Application Firewall
The statistics vary among product types. Most include the following sections:
- Products – Shows all of the products connected to Barracuda Cloud Control.
- Subscriptions – Shows status of all Energize Updates, Instant Replacement (where applicable) and Premium Support (where applicable). A warning shows if one or more subscription items are either expired or not yet activated. An orange warning indicates a subscription is about to expire.
- Updates – Shows whether there are energize updates available for the connected products. If updates are available, follow the link to install them.