It seems like your browser didn't download the required fonts. Please revise your security settings and try again.
Barracuda XDR

Getting Detailed Information on the Event Timeline Graph on the Home Dashboard

  • Last updated on

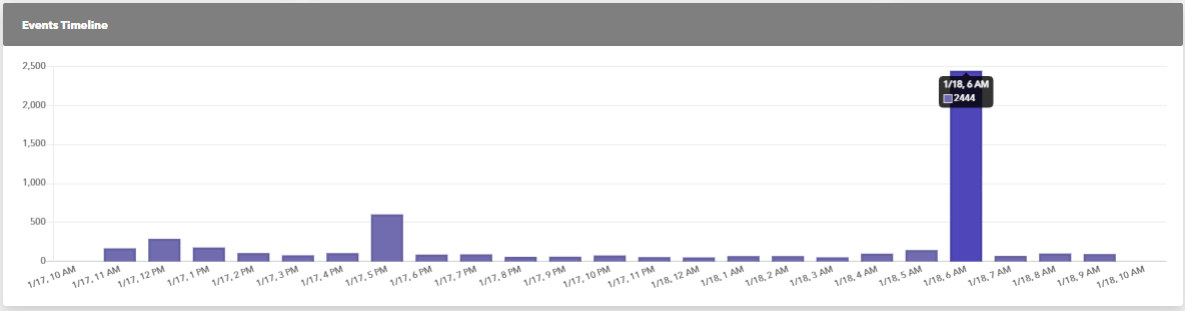
The Event Timeline graph on the Home Dashboard displays a bar graph of events (Alarms and alerts) for the account and timeframe you choose.

Events Timeline.png

For more information on events, alarms, and alerts, see Introduction to Alarms, Alerts, and Events.

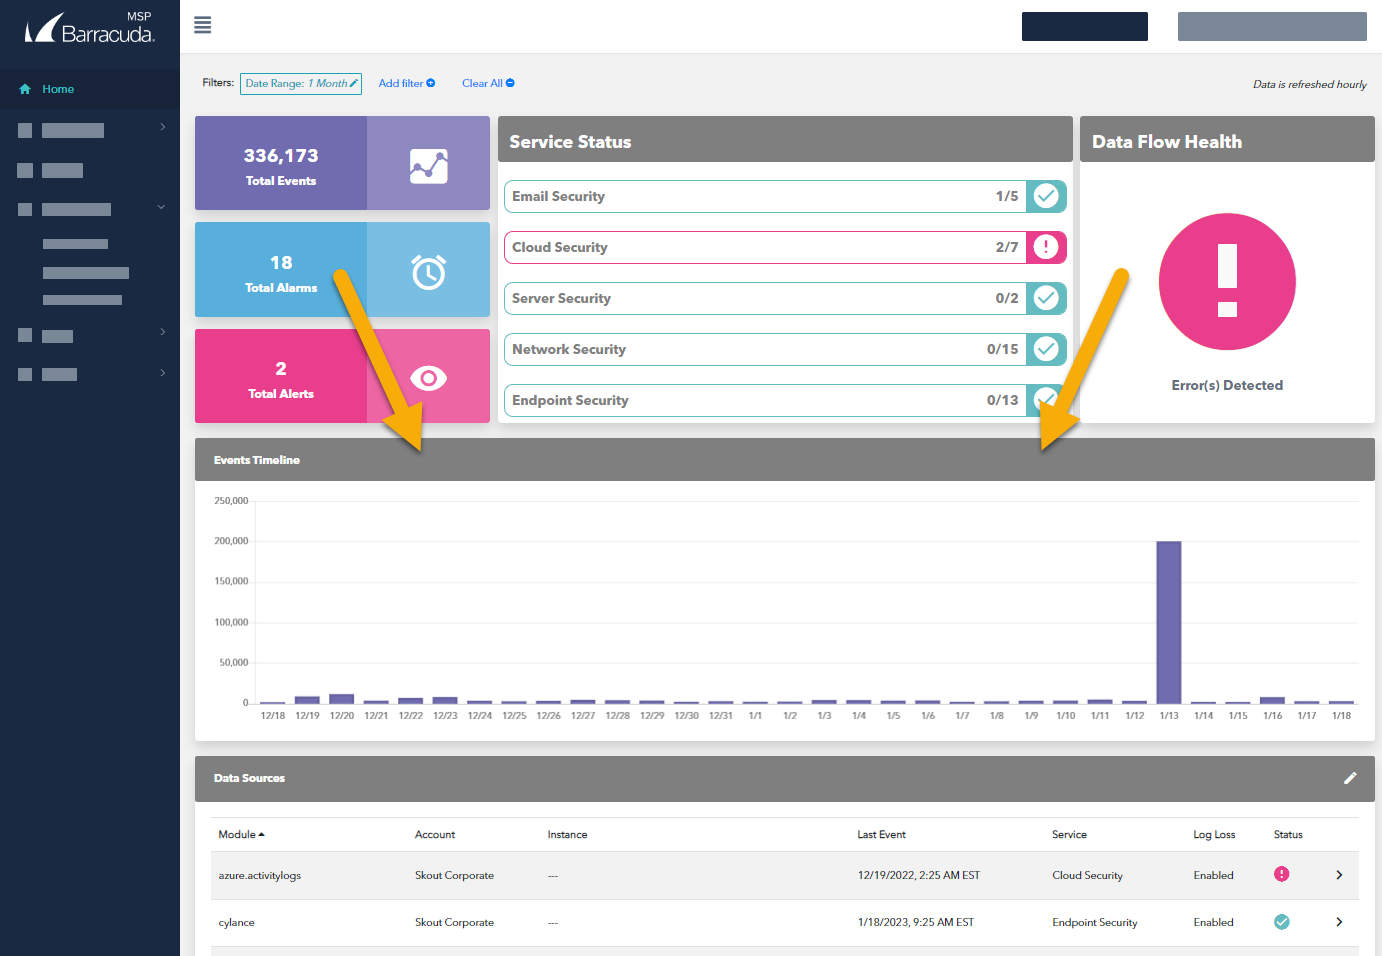
The number of events is displayed on the vertical axis. The hours or dates are displayed on the horizontal axis.

You can see additional information by hovering your cursor over parts of the graph bars.

To choose the account displayed, see To switch accounts in Navigating around Barracuda XDR Dashboard. To choose the timeframe displayed, see To change the timeframe displayed on the Home Dashboard in Changing the Timeframe Displayed on the Home Dashboard.

To see the total events for a date or hour
  1. In Barracuda XDR Dashboard, click Home.
  2. On the Events Timeline, hover your cursor over the bar.
    The date and number of alarms is displayed.
    Event Timeline.png