The Incident Timeline graph, on the Security Overview page, displays a bar graph of incidents (Alarms and alerts) for the account and timeframe you choose.
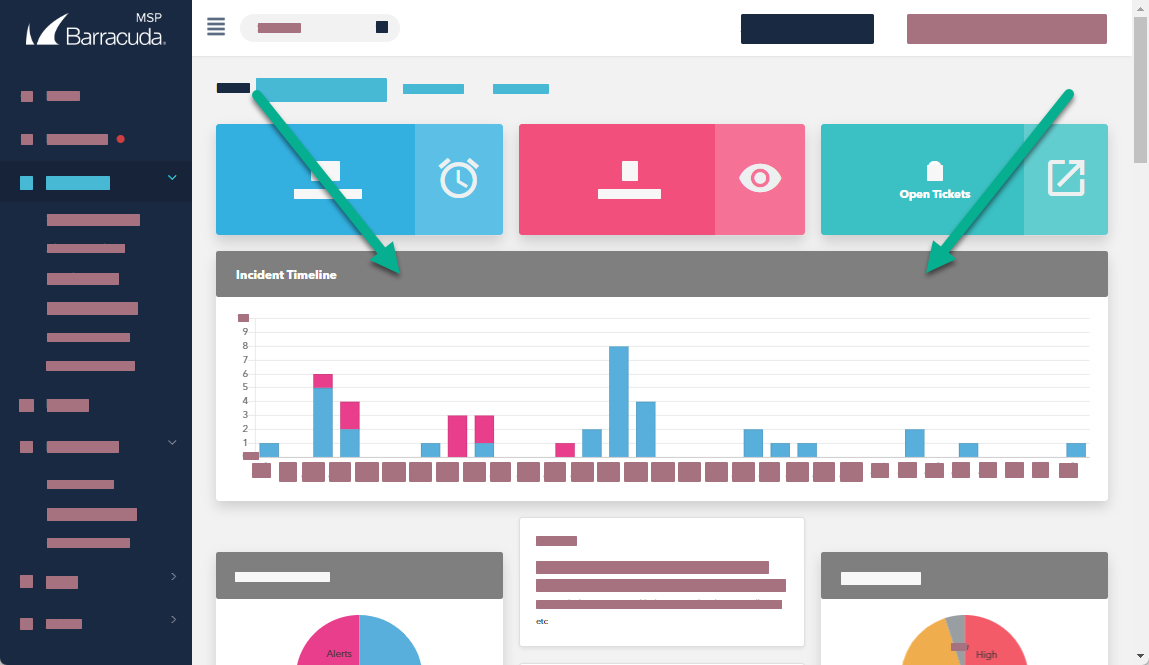
The number of incidents is displayed on the vertical axis. The hours or dates are displayed on the horizontal axis.
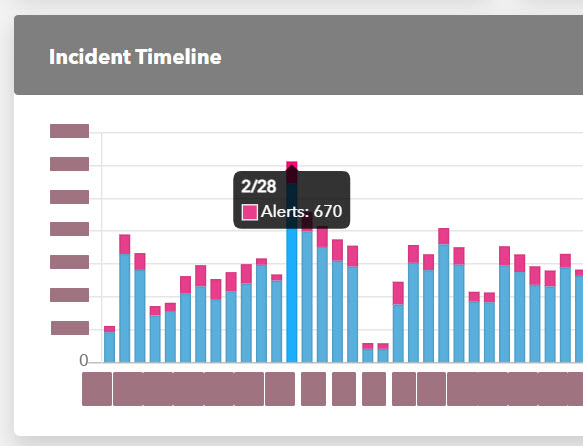
You can see additional information by hovering your cursor over parts of the graph bars.
To choose the account displayed, see To switch accounts in Navigating around Barracuda XDR Dashboard.
To choose the timeframe displayed, see To change the timeframe displayed on the Security Overview procedure in Changing the Date Range Displayed on the Security Overview.
To filter the data, see using the To create and apply a Security Overview filter procedure in Filtering the Security Overview.
To see the total alarms for a date or hour
- In Barracuda XDR Dashboard, click Intelligence > Security Overview .
- On the Incident Timeline, hover your cursor over the blue part of a bar.
The date and number of alarms is displayed.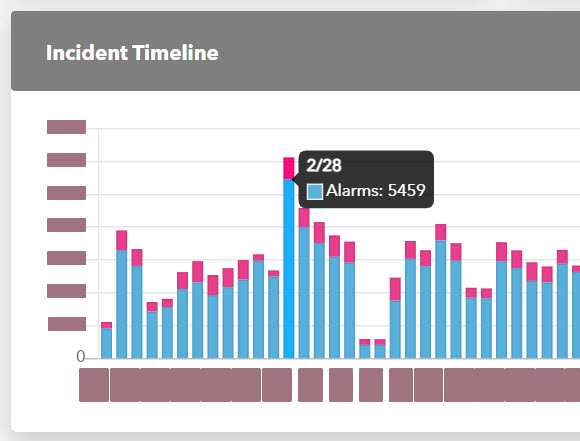
To see the total alerts for a date or hour
- In Barracuda XDR Dashboard, click Intelligence > Security Overview .
- On the Incident Timeline, hover your cursor over the pink part of a bar.
The date and number of alarms is displayed.