

The Security Overview displays total alarms, alerts, and tickets as well as the Incident Timeline; and the Incident Geo Source graph. You can use the tools on the Security Overview to focus your data, making it easy to find the information you're looking for.
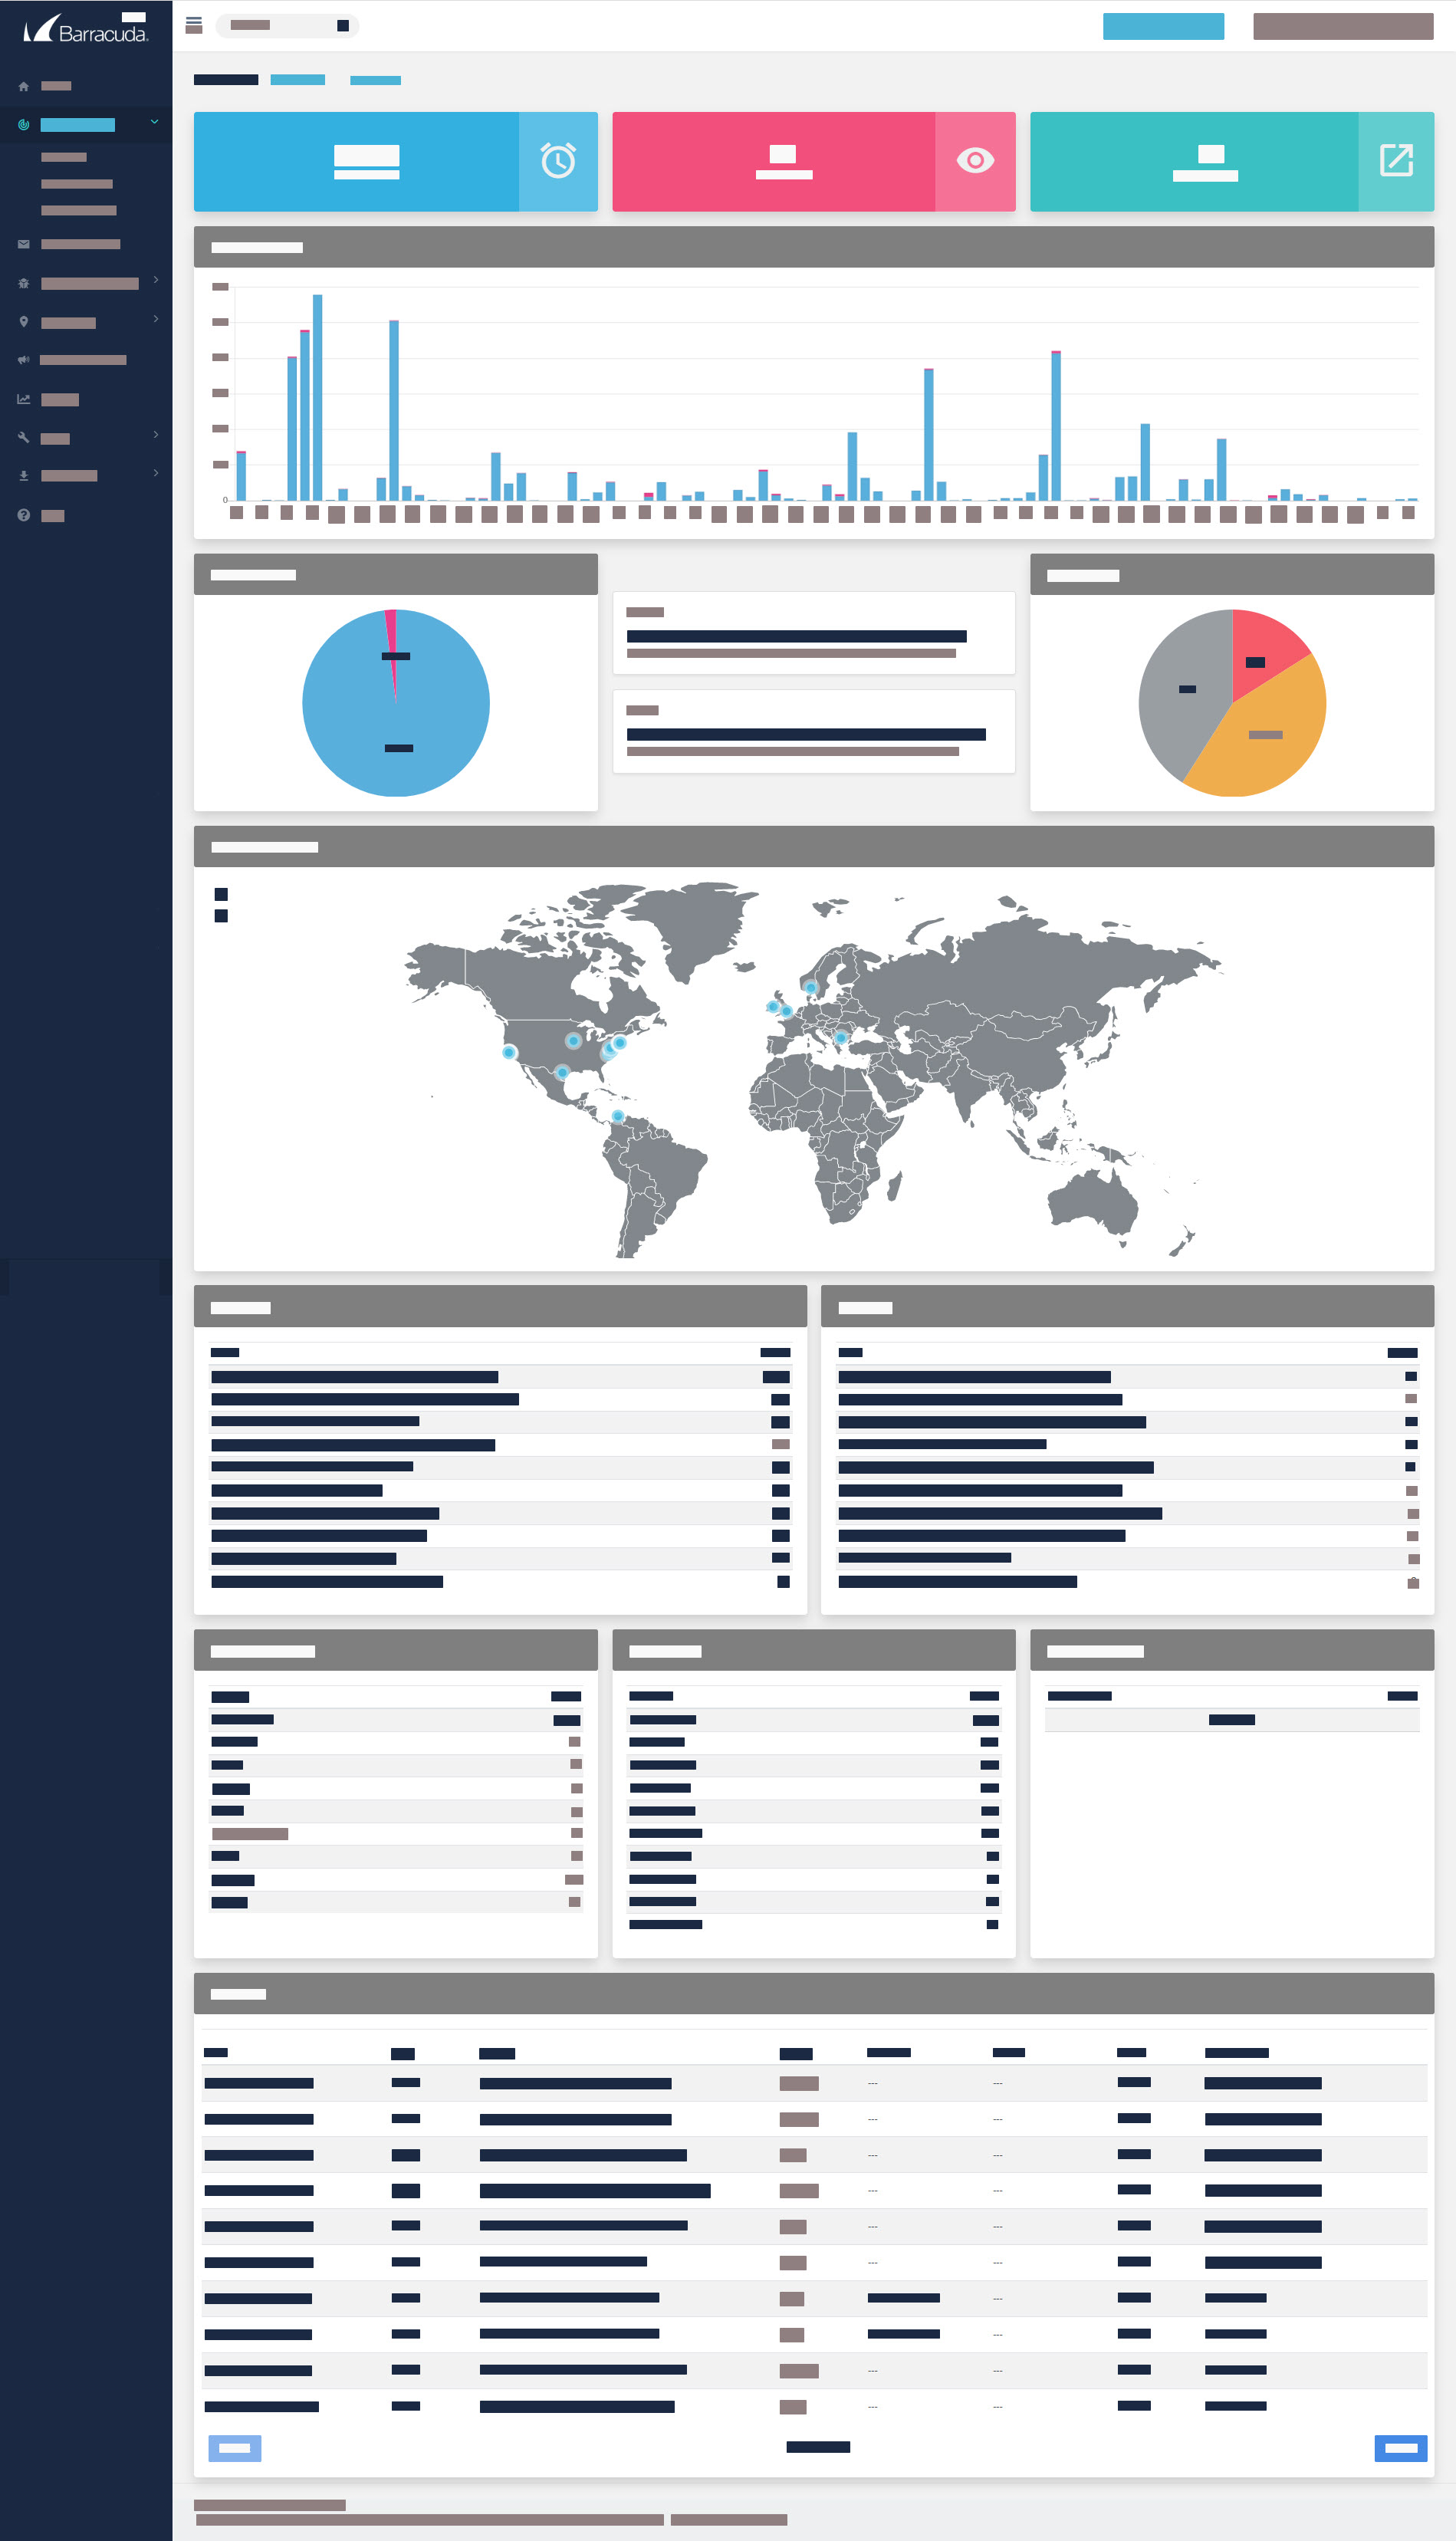
The Security Overview shows the following information:
- Total Alarms - Displays the total number of alarms.
- Total Alerts - Displays the total number of alerts.
- Open Tickets - Displays the number of open tickets.
- Incident Timeline - Displays a bar graph of incidents (Alarms and alerts). You can see additional information by hovering your cursor over parts of the graph bars. For more information, see Getting Detailed Information on the Incident Timeline Graph on the Security Overview.
- Alarms vs Alerts graph - Displays the percentage of incidents that are alarms versus alerts.
- Alarm Impact graph - Displays the percentage of alarms that have an impact of High, Medium, and Low.
- Top Alarms - Displays the top 10 alarms.
- Top Alerts - Displays the top 10 alerts.
- Top Source Country - Displays the top 10 countries that are the source of incidents.
- Top Source IP - Displays the top 10 IPs that are the source of incidents.
- Top Destination IP - Displays the top 10 IPs that are the destinations of incidents.
- All Tickets – Displays all tickets sorted in reverse chronological order, displaying the time of the ticket was created, the type of ticket, the subject, impact level, source and destination IP if applicable, the ticket status, and the closure code.
For information about what you can do on the Security Overview, see the following:
- Filtering the Security Overview
- Changing the Date Range Displayed on the Security Overview
- Getting Detailed Information on the Incident Timeline Graph on the Security Overview
- Viewing Tickets on the Security Overview