

This article describes how to verify the Barracuda RMM is parsing traps properly as they are received by the system it is installed on. Unlike iReasoning's trap receiver, it is not necessary to stop the MWExpertSystem while troubleshooting when using Wireshark, which is useful when solving long-term or intermittent issues.
Since the wincap driver grabs packets as soon as they hit a port, before a software firewall can block them, Wireshark can monitor traffic on port 162 while MWExpertSystem is running.
To enable Wireshark monitoring
- Install Wireshark - including the installer's WinPcap driver.
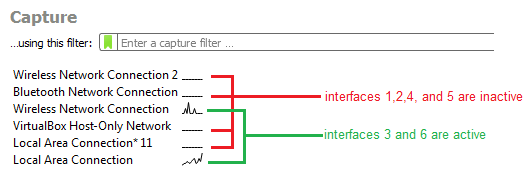
- Start Wireshark and take note of which interface(s) are active (sending and receiving traffic):
- Do one of the following:
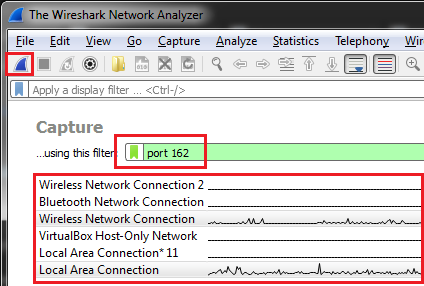
- If you are going to be capturing for a short period of time, for example, while you are on the phone, enter the following capture filter: port 162 and select the two interfaces. Click the blue shark fin on the top right to start capturing.
- If you want a long term capture, start up the capture using tshark.exe from the command line instead, making sure to specify an output file and stop condition. Information about the command line options is available here. An example of this would be:

where the -i flags indicate which interface to capture, -a indicated the stop condition 10mb of capture) and -w is the output file. You can use `-a duration:600 ` instead to stop after 10 minutes (duration is in seconds).
- If you are going to be capturing for a short period of time, for example, while you are on the phone, enter the following capture filter: port 162 and select the two interfaces. Click the blue shark fin on the top right to start capturing.
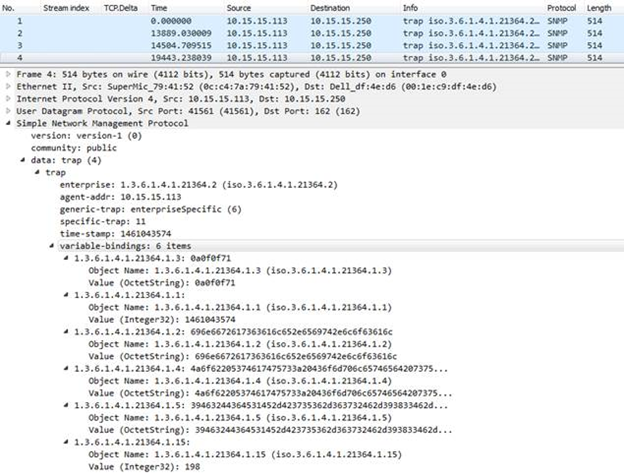
- Once you've captured the data, you will see the list of received UDP packets. Selecting a packet will give you additional information if you expand the Simple Network Management Protocol tree. This information includes the SNMP version, the community string, the enterprise OIDs, and variable bindings:
- You will notice that most values are either Integers or OctetStrings. The string values are displayed in hexadecimal by default, but you can see a pageview of the string values in the bottom pane, or you can rick clock on the value and Copy > as Printable Text.
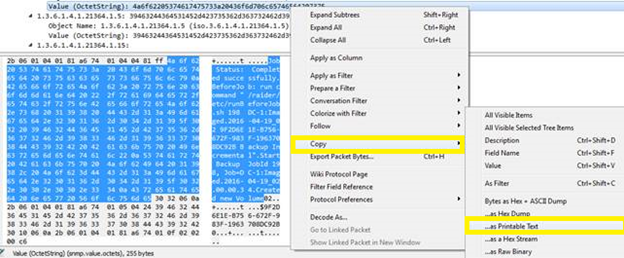
- This lets you paste the textual value which you can use to help create or verify monitoring rules. For example:
