

The Barracuda SecureEdge Manager allows administrators to configure syslog streaming. Syslog streaming can be enabled for an entire workspace, but you can disable it for a specific Site, Private Edge, Edge Service for VWAN, or hosted Edge Service. You can stream logs to syslog using either UDP or TCP. You can also stream logs to syslog using TCP with a certificate. HA pairs must stream logs either directly or via the active box. New Edge Services inherit the syslog settings from your existing workspace.
Configure Syslog Streaming
Go to https://se.barracudanetworks.com and log in with your existing Barracuda Cloud Control account.
In the left menu, click the Tenants/Workspaces icon and select the workspace you want to configure syslog streaming for.
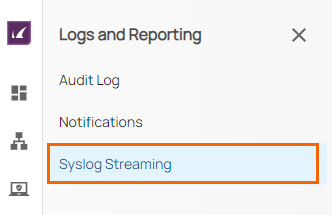
Go to Logs and Reporting > Syslog Streaming.
- The Syslog Streaming page opens. Specify values for the following parameters:
- Enable Syslog – Click to enable/disable. By default, syslog is OFF.
- Syslog Server – Enter the IP address or hostname of your syslog server. Note: Only one destination syslog server is supported.
- Protocol – Select a data transfer protocol from the drop-down list. You can choose between UDP, TCP, and TCP+TLS.
When TCP+TLS selected, the following options are available:- Upload SSL Certificate – Click Upload File to upload a SSL Certificate. Note: For SSL Certificates, only the .pem file format is supported.
- Certificate Common Name – If SSL Certificate has been uploaded successfully and the configuration is saved, you will be provided with certificate name and expiry date. For example, in this case: Barracuda Networks.
- Certificate Expiry Date – You are provided with expiration date of your SSL Certificate.
Security Protocol – Select a security protocol from the drop-down list. The default security protocol TLS1.2 is enabled for TCP+TLS. You can choose between TLSv1.2, TLSv1.1, TLSv1.0, and SSLv3.
- Port – Enter a target port for your syslog server. The default UDP port is 514, TCP port is 601, and TCP+TLS port is 6514.
Logs – Select the appliance logs you want to stream. You can choose at least one log from either section, such as Security and Service.
The following Logs are available: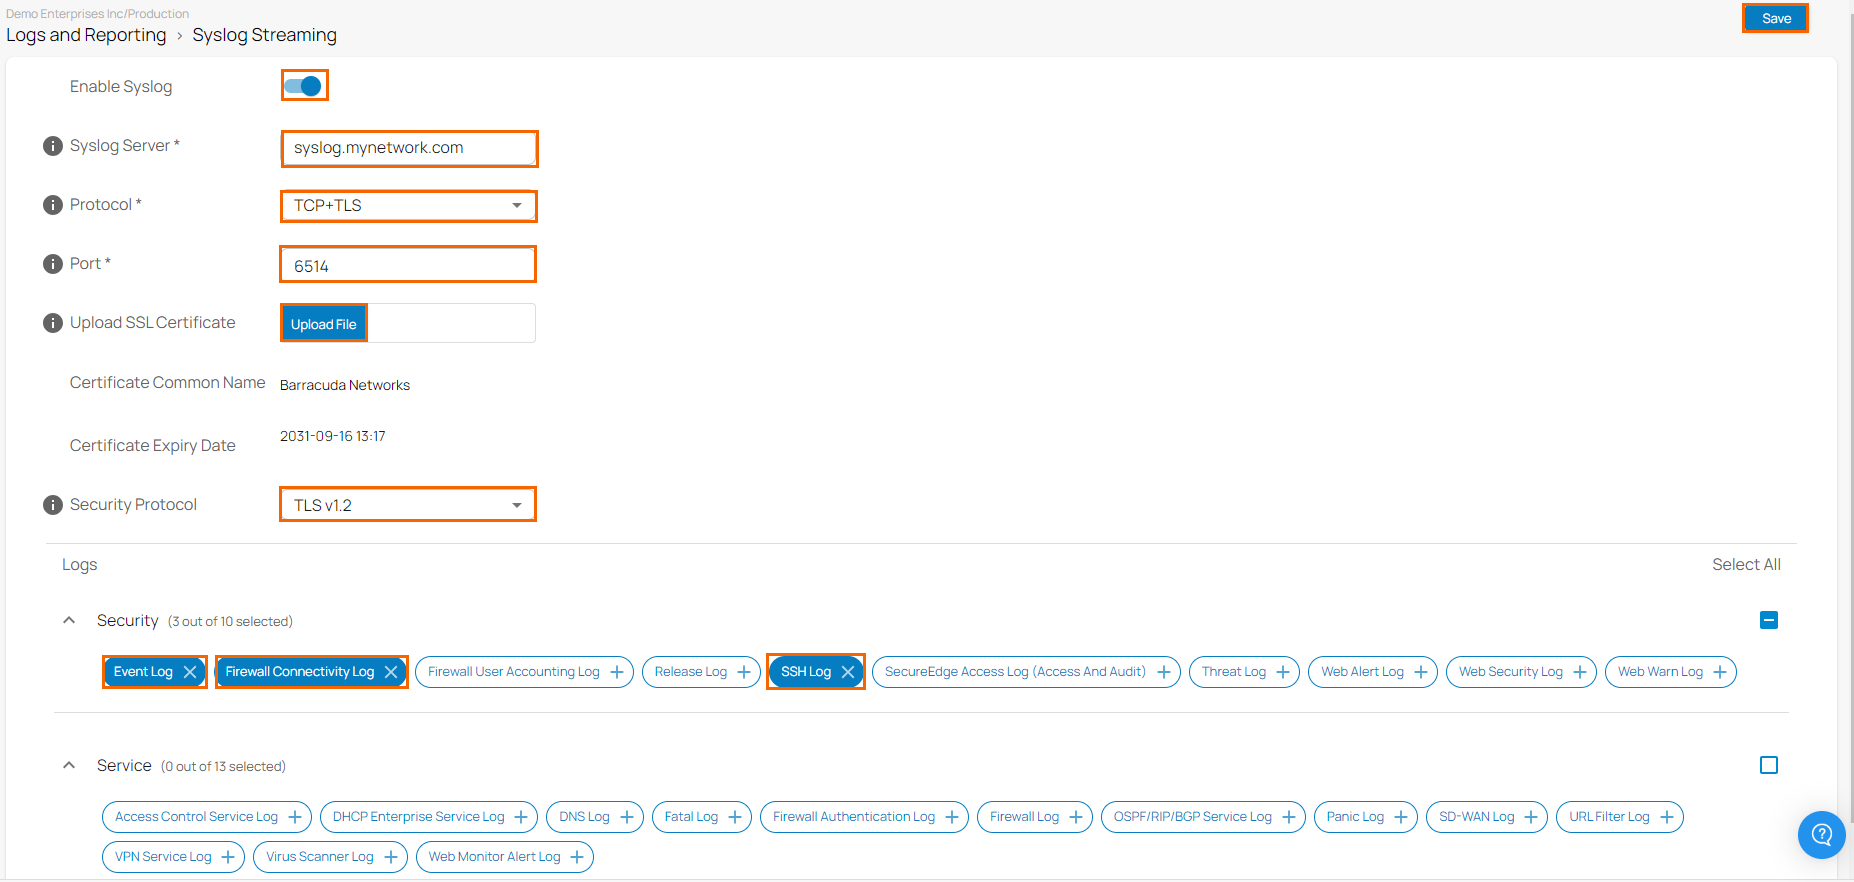
- Click Save.
After the configuration is complete, Sites and Edge Services in the selected workspace will then stream to your syslog server.
Disable Syslog Streaming for Specific Sites
You can disable syslog streaming for a specific site in your selected workspace:
Open https://se.barracudanetworks.com/ in your web browser and log in with your existing Barracuda Cloud Control account.
In the left menu, click the Tenants/Workspaces icon and select the workspace containing your site.
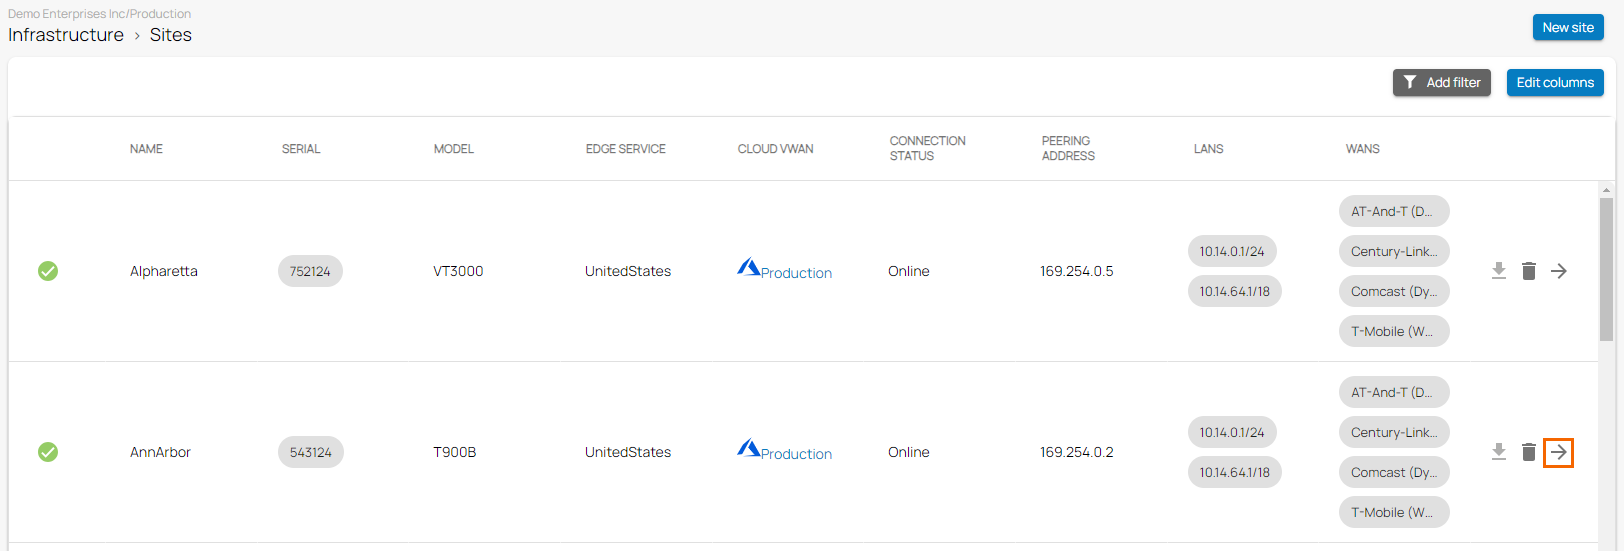
- Go to Infrastructure > Sites.
- The Sites page opens. Select the site you wish to disable syslog streaming for. You can either search for the name or serial, or use filters to tailor the list of displayed sites. You can also simply scroll through the list.
- Click on the arrow icon next to the site.
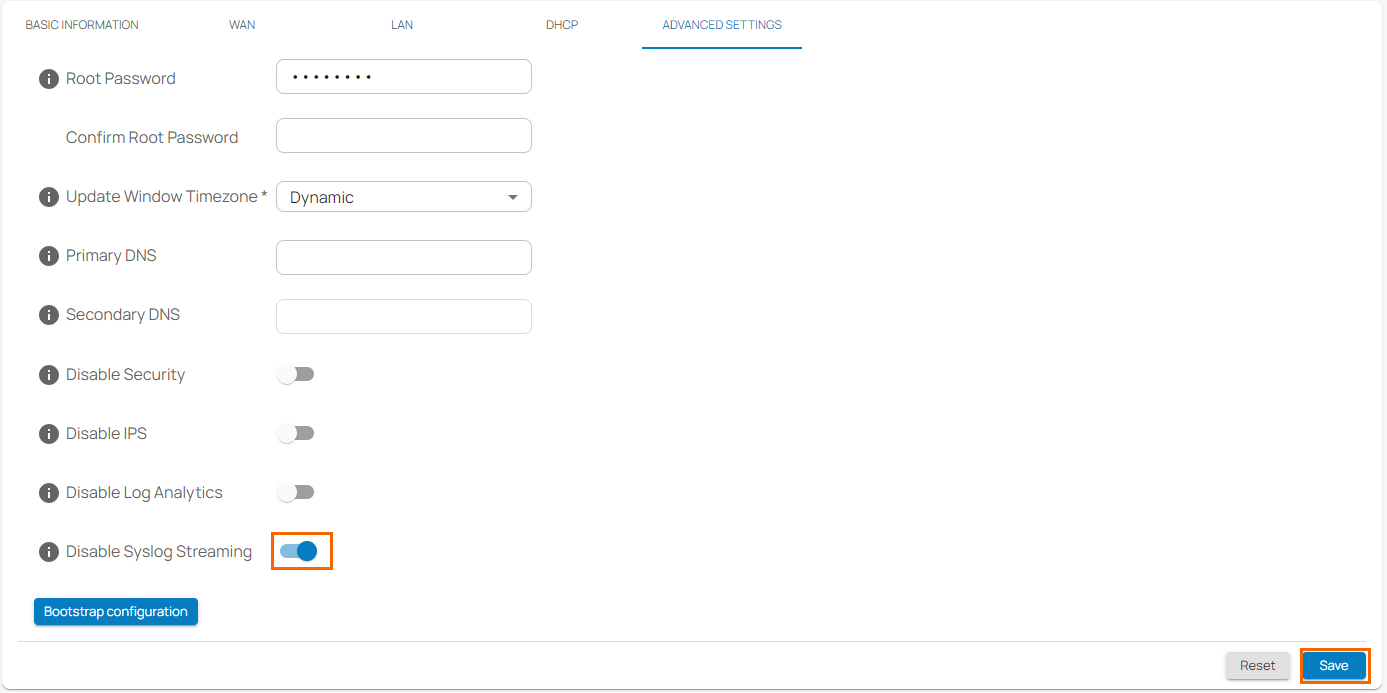
- In the site menu, go to Settings > ADVANCED SETTINGS.
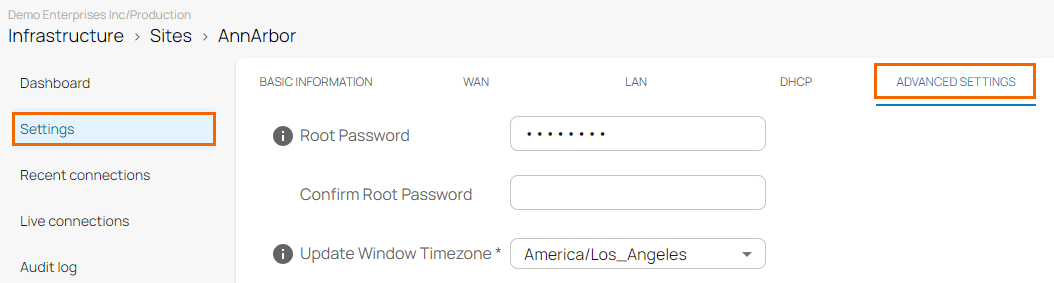
- At the bottom of the window, click to Disable Syslog Streaming.
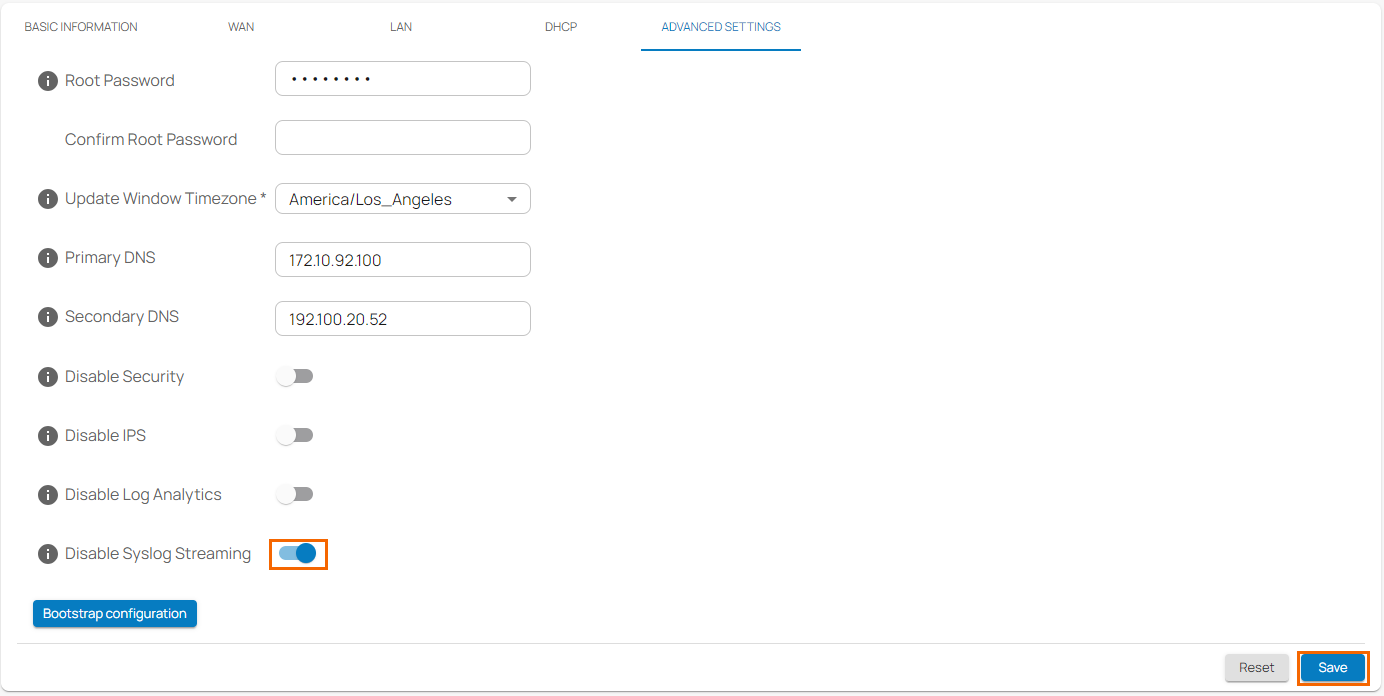
- Click Save.
After the configuration is saved, the selected site in your selected workspace stops streaming logs to syslog.
Disable Syslog Streaming for an Edge Service
You can disable syslog streaming for a specific edge service in your selected workspace:
- Go to https://se.barracudanetworks.com and log in with your existing Barracuda Cloud Control account.
- In the left menu, click the Tenants/Workspaces icon and select the workspace containing your edge service.
- Go to Infrastructure > Edge Services.
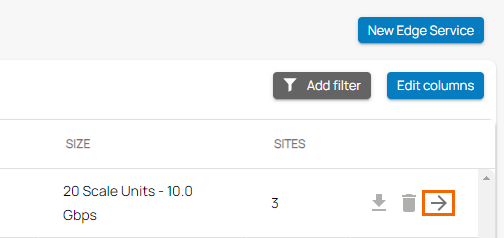
- The Edge services page opens. Select the edge service you wish to disable syslog streaming for.
- Click on the arrow icon next to the edge service you are interested in.
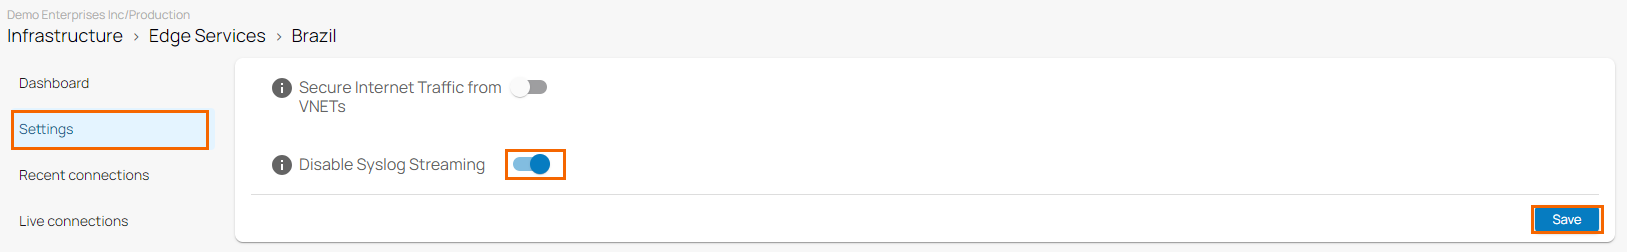
- The selected edge service page opens. In the edge service menu, click Settings.
- Click to Disable Syslog Streaming.
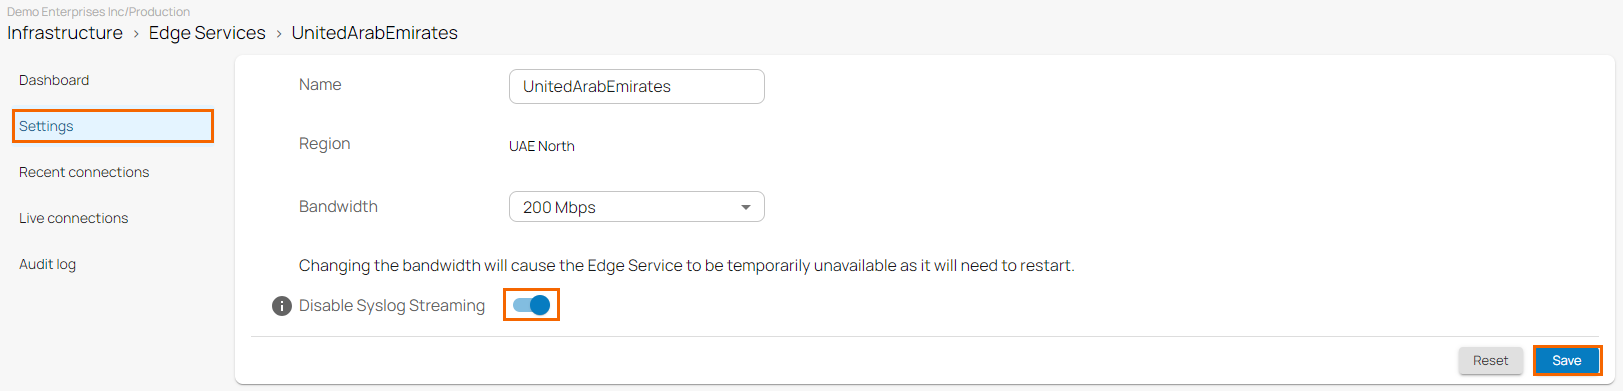
- Click Save.
Disable Syslog Streaming for a Private Edge Service
You can disable syslog streaming for a specific private edge service:
- Go to https://se.barracudanetworks.com and log in with your existing Barracuda Cloud Control account.
- In the left menu, click the Tenants/Workspaces icon and select the workspace containing your private edge service.
- Go to Infrastructure > Edge Services.
- The Edge services page opens. Select the private edge service you wish to disable syslog streaming for.
- Click on the arrow icon next to the private edge service you are interested in. The selected private edge service page opens.
- In the private edge service menu, go to Settings > ADVANCED SETTINGS.
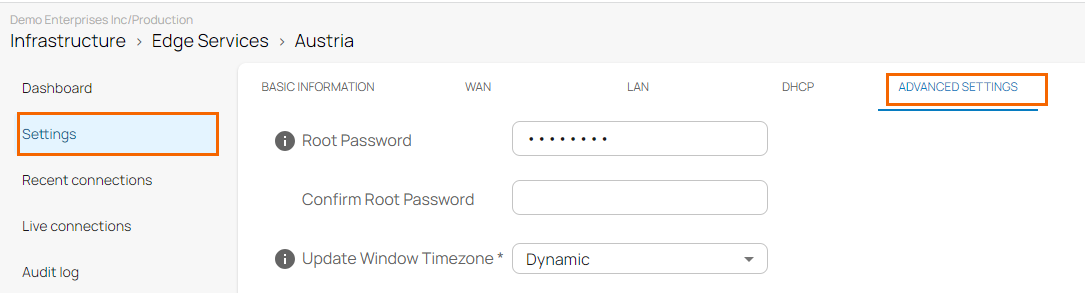
- At the bottom of the window, click to Disable Syslog Streaming.
- Click Save.
Disable Syslog Streaming for Edge Service for VWAN
You can disable syslog streaming for a specific edge service for VWAN:
- Go to https://se.barracudanetworks.com and log in with your existing Barracuda Cloud Control account.
- In the left menu, click the Tenants/Workspaces icon and select the workspace containing your edge service for VWAN.
- Go to Infrastructure > Edge Services.
- The Edge services page opens. Select the edge service for VWAN you wish to disable syslog streaming for.
- Click on the arrow icon next to the edge service you are interested in. The selected edge service for VWAN page opens.
- In the edge service menu, click Settings.
- Click to Disable Syslog Streaming.
- Click Save.