

ArchiveOne installs a number of services on the Archive server. You may observe that Application error events are reported in the Windows Application Event Log. The ArchiveOne services are designed for robustness; for instance, in the event that the ArchiveOne Service crashes, the ArchiveOne Monitor Service restarts the process.
Examine Windows Event Log
If you are observing a crash of an ArchiveOne service, rather than an issue which is simply causing a service restart without crashing, examine the Windows Event Log:
- On the Archive server, open the Control Panel, and open Administrative Tools > Event Viewer, or run eventvwr.
- Expand Windows Logs, and select Application.
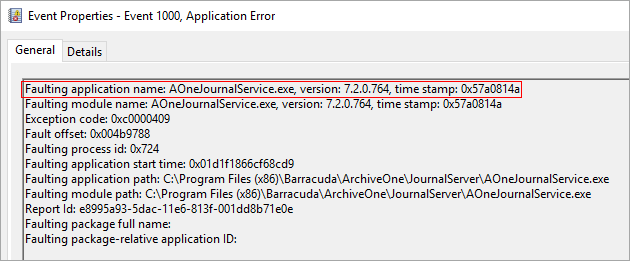
- If an ArchiveOne service process has crashed, an Error event with source Application Error and event ID 1000 is generated. In the event properties, click the General tab to view the name of the process that has crashed in the Faulting application name line. For example, AOnePolService.exe (the ArchiveOne Service), or AOneJournalService.exe (the ArchiveOne Journal Archiving Service):
Diagnose the Issue
Once you confirm there is an Application Error event, diagnose the issue.
Ensure you are running the latest version of ArchiveOne by contacting Barracuda Networks Support, who can advise you if an upgrade is available. Once you confirm you are running the latest version, and if the Application Error continues to occur, collect diagnostic information using the following steps:
Ensure that Advanced tracing is configured; see How to Enable Advanced Tracing for step-by-step instructions.
Set up ProcDump to monitor the process named in the Application Error event using the steps in the article How to Troubleshoot Using ProcDump.
Once the issue reoccurs, upload the service tracing as described in How to Enable Advanced Tracing.
Collect the generated crash dump as described in How to Troubleshoot Using ProcDump.
If ProcDump does not generate a dump file, you may be able to collect the dump generated by Windows Error Reporting using the following steps:
- Immediately following the Application Error event, look for Information events created by Windows Error Reporting with event ID 1001.
- In the event properties, click the General tab and look for the location of the diagnostic files after the line The files may be available here:
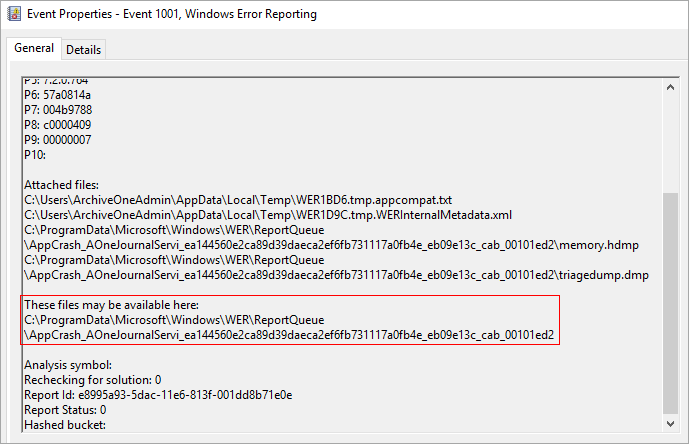
- Browse to the file location, in the above example:
C:\ProgramData\Microsoft\Windows\WER\ReportQueue\AppCrash_AOneJournalServi_ea144560e2ca89d39daeca2ef6fb731117a0fb4e_eb09e13c_cab_00101ed2 - If present in the folder, send all of the files to Barracuda Networks Support for analysis.