To add a Log Analytics workspace to Microsoft Sentinel in Microsoft Azure, you must first connect your Barracuda SecureEdge with a Log Analytics workspace. Microsoft Sentinel allows you to create custom workbooks across your data. Workbooks are used for querying data from multiple sources in Azure and visualising data for reporting and analysis. The template used will deploy a workbook into a new or existing Log Analytics workspace and provide basic information on VPN Status, Device Availability, Device Performance, Device Bandwidth, and WAN Latency.
Barracuda SecureEdge Workbook
The Barracuda SecureEdge workbook is available in the Barracuda Networks GitHub account:
https://github.com/barracudanetworks/secureedge/tree/main/azure-workbook
Before You Begin
- Create a Microsoft Azure account.
- Create a Log Analytics workspace and connect Barracuda SecureEdge with the Microsoft Azure Log Analytics workspace. For more information, see How to Configure Log Streaming to Microsoft Azure Log Analytics Workspace.
Step 1. Add Log Analytics Workspace to Microsoft Sentinel
- Log into the Azure portal: https://portal.azure.com
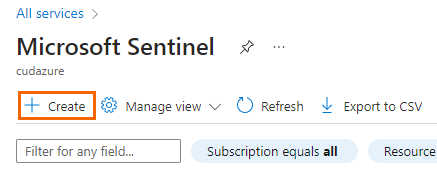
- In the left menu, click All services and search for Microsoft Sentinel.
- Click Create.
- Select the newly created Log Analytics workspace. For example, in this case: Campus-LogAnalytics-workspace.
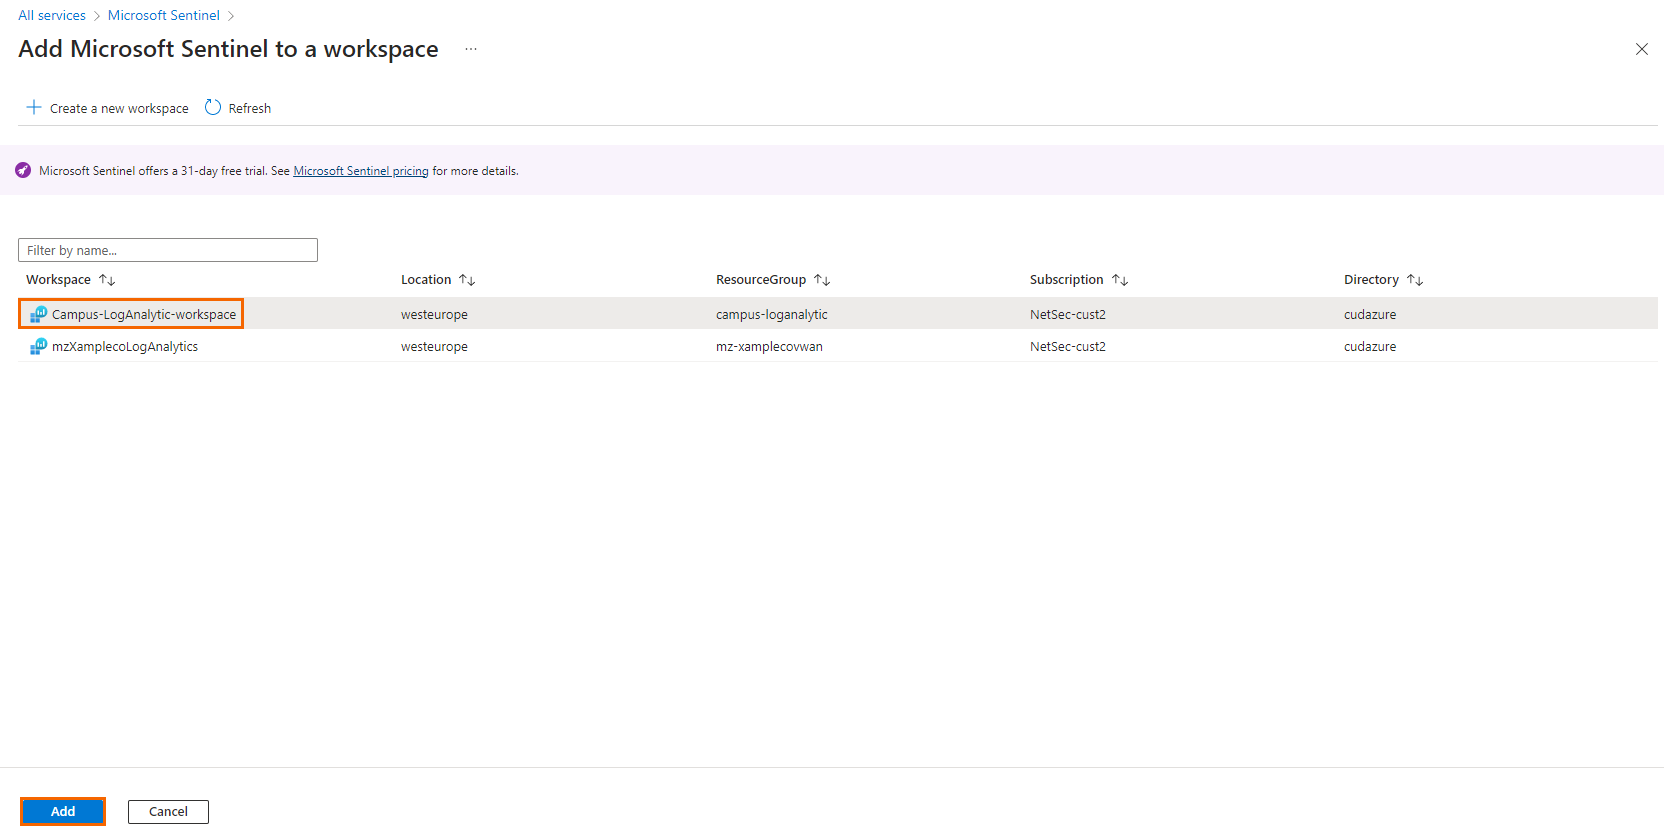
- Click Add.
Step 2. Deploy a Workbook
- Log into the Azure portal: https://portal.azure.com
- In the left menu, click All services, search for the Log Analytics workspace you created, and pin it to your dashboard.
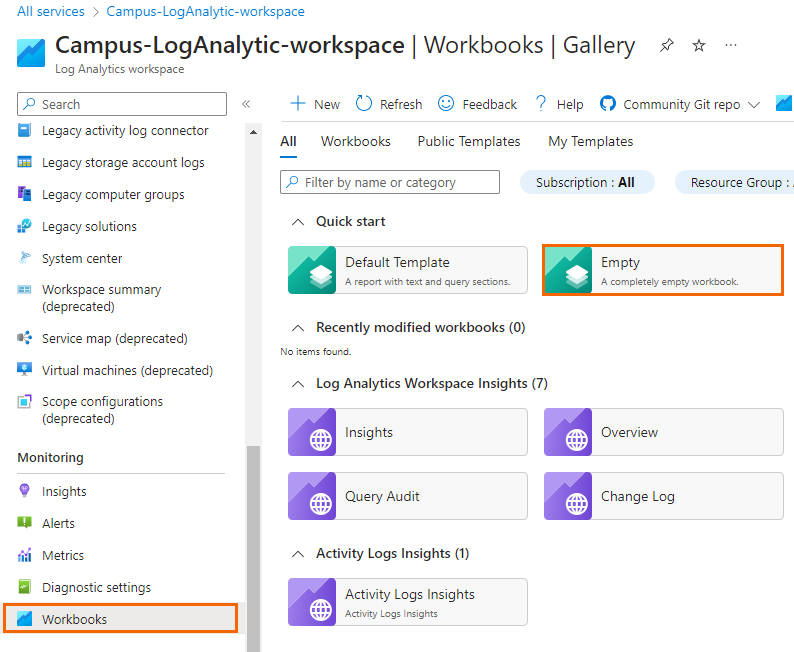
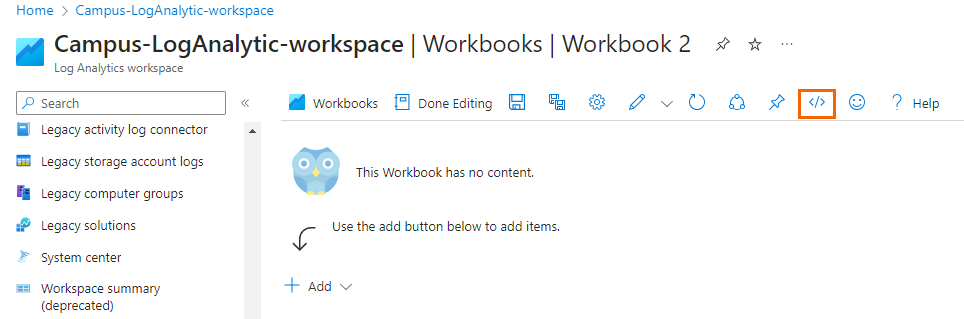
- In the Campus-LogAnalytic-workspace menu, select Workbooks. Create an Empty workbook.
- Click the Advanced Editor icon and delete the existing content of Gallery Template.
- Open the SecureEdge workbook. For example, in this case: SecureEdgeWorkbook.json.
- Click Raw to copy the content of a workbook and paste it in your workbook's Gallery Template.
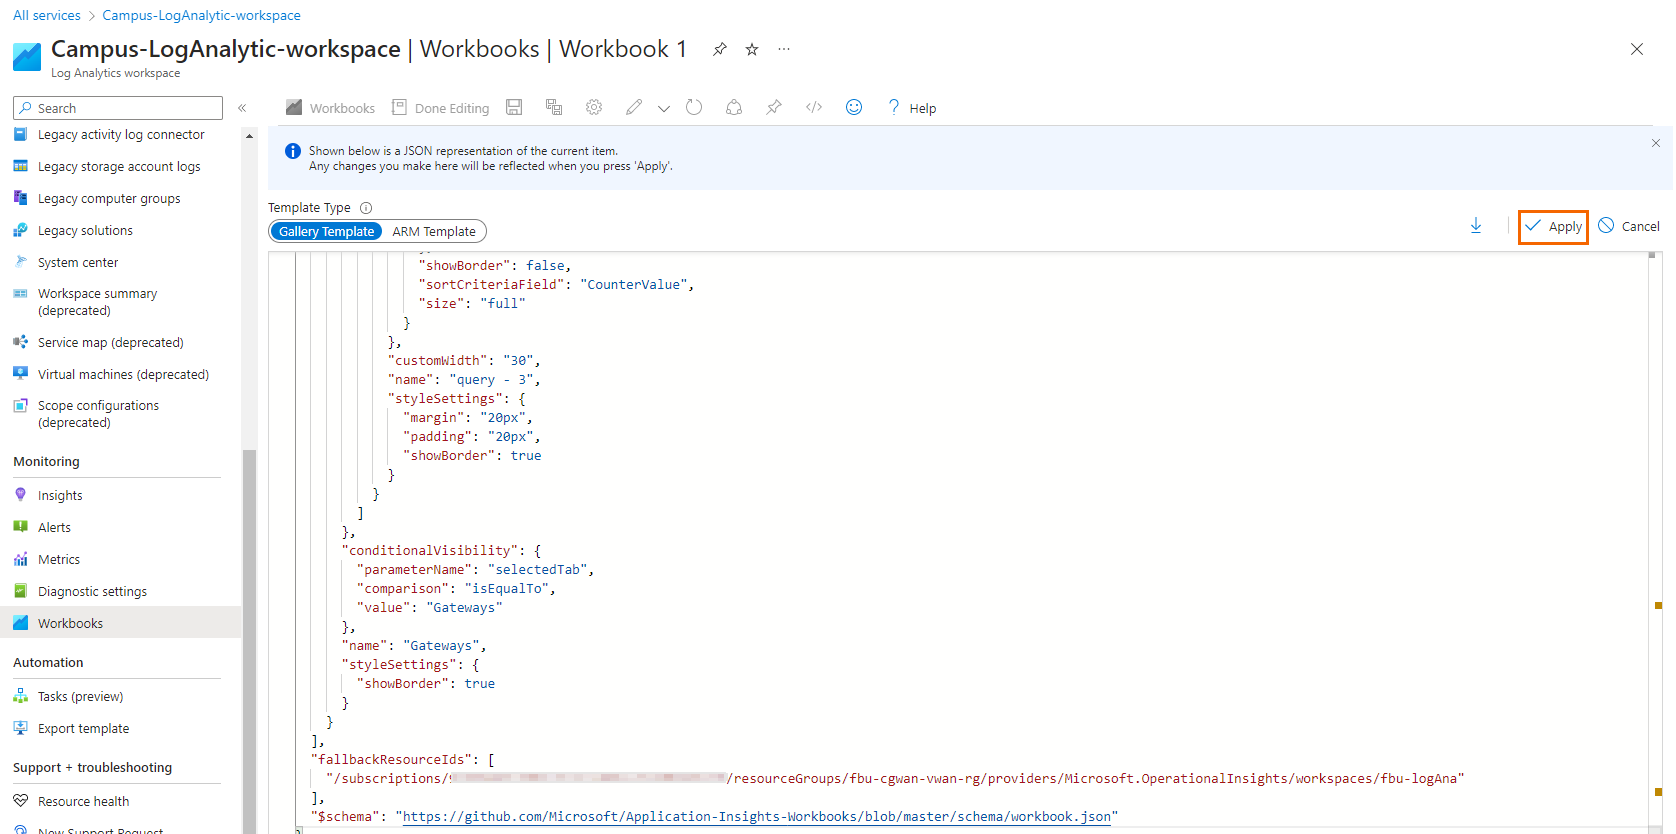
- Click Apply. You can see that a new workbook has been created. Wait briefly to fetch the log data.
- To save this workbook, select Done Editing in Advanced Editor, and then click Save.
- The Save As page opens. Enter the name of workbook.
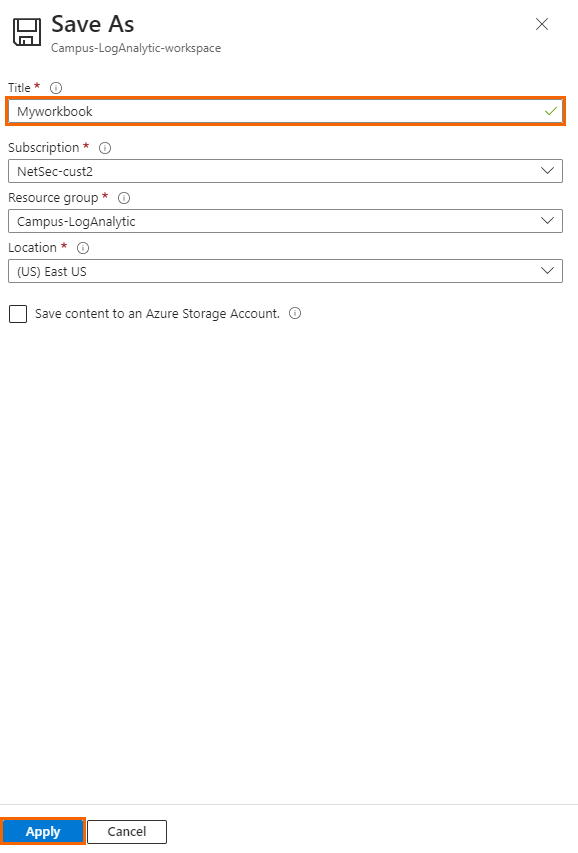
- Click Apply.
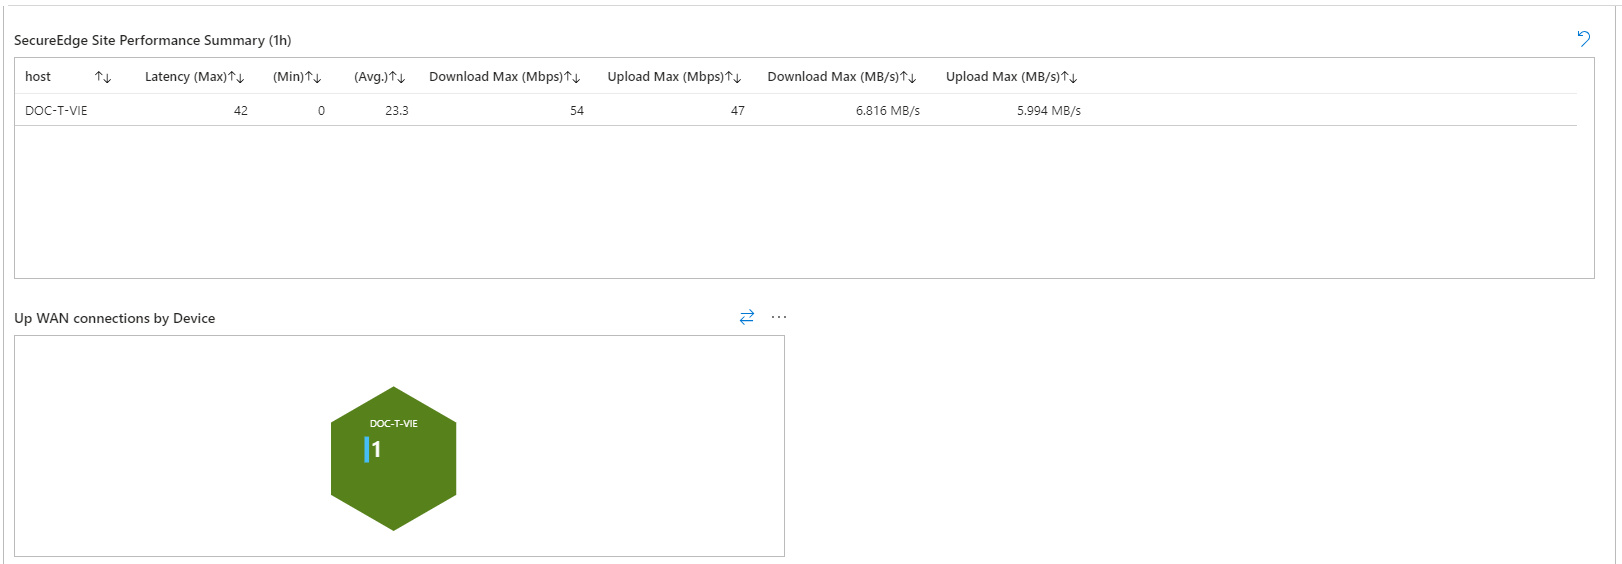
You can now see the log data streaming to a Log Analytics workspace. On the SecureEdge workbook, the Overview page opens. Select the Site device and Time frame from the drop-down list.
The Overview page provides following details:
- SecureEdge Device Availability
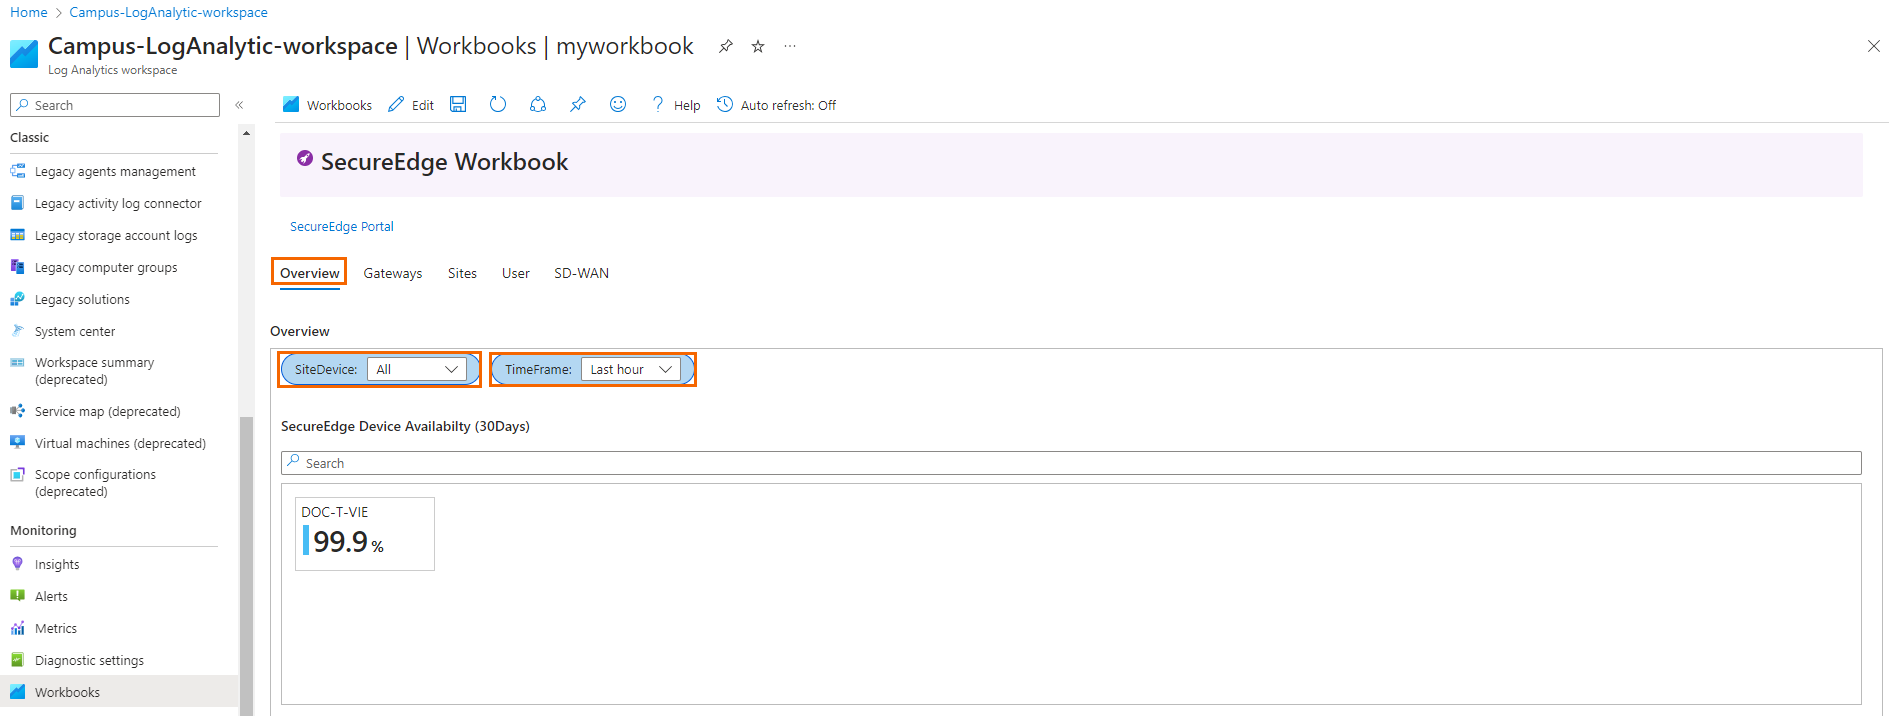
- SecureEdge Site Performance Summary
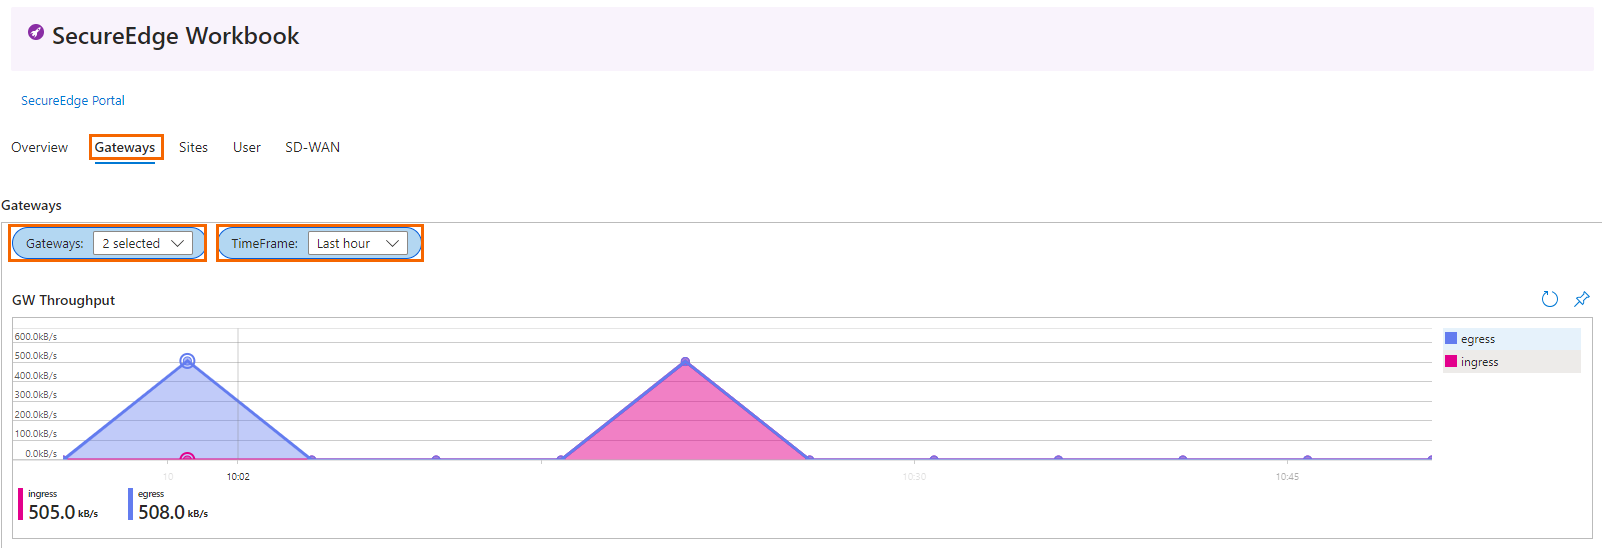
Accessing Information on the Gateways Page
The Gateways tab provides the information on gateway throughput. You can see a graphical representation of the egress and ingress traffic. In addition, it displays information on connected sites and connected remote clients.
At the top of the workbook, click Gateways. Select Gateways and specify the Time frame from the drop-down list. Note: To get the complete result for gateways, you must wait several hours.
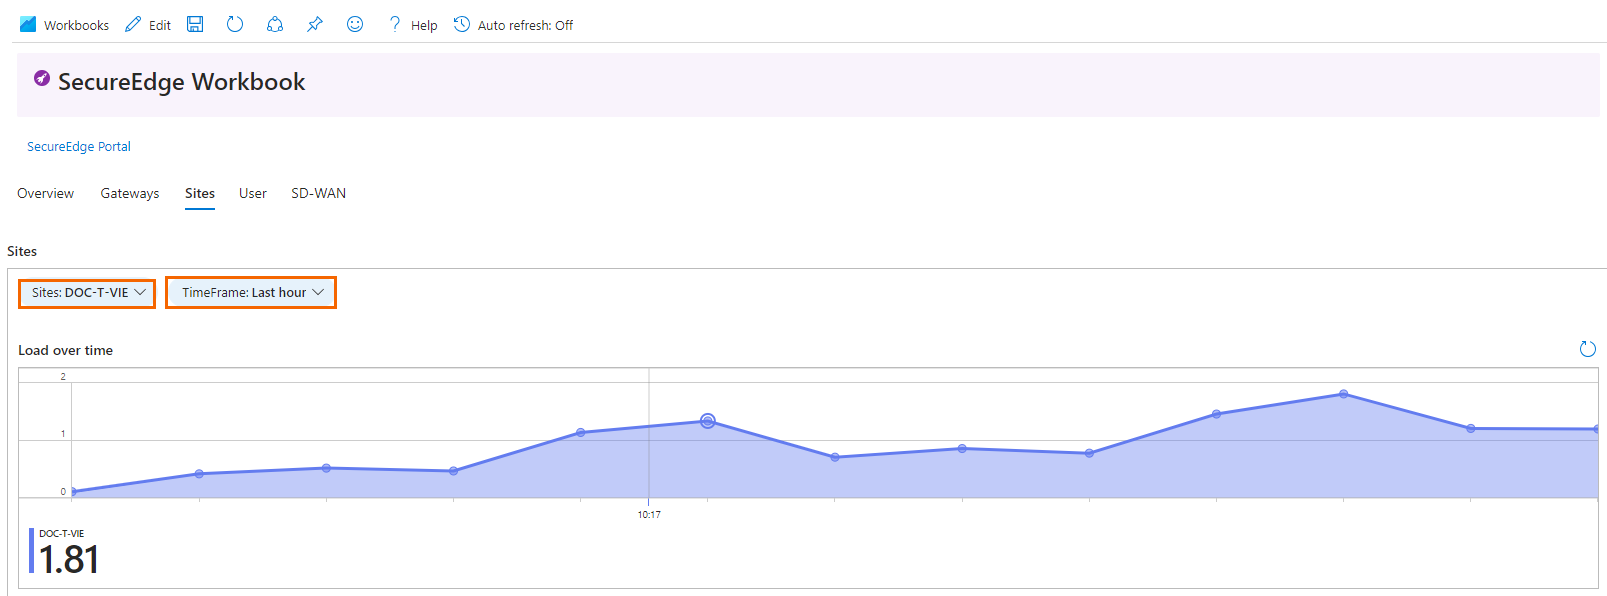
Accessing Information on the Sites Page
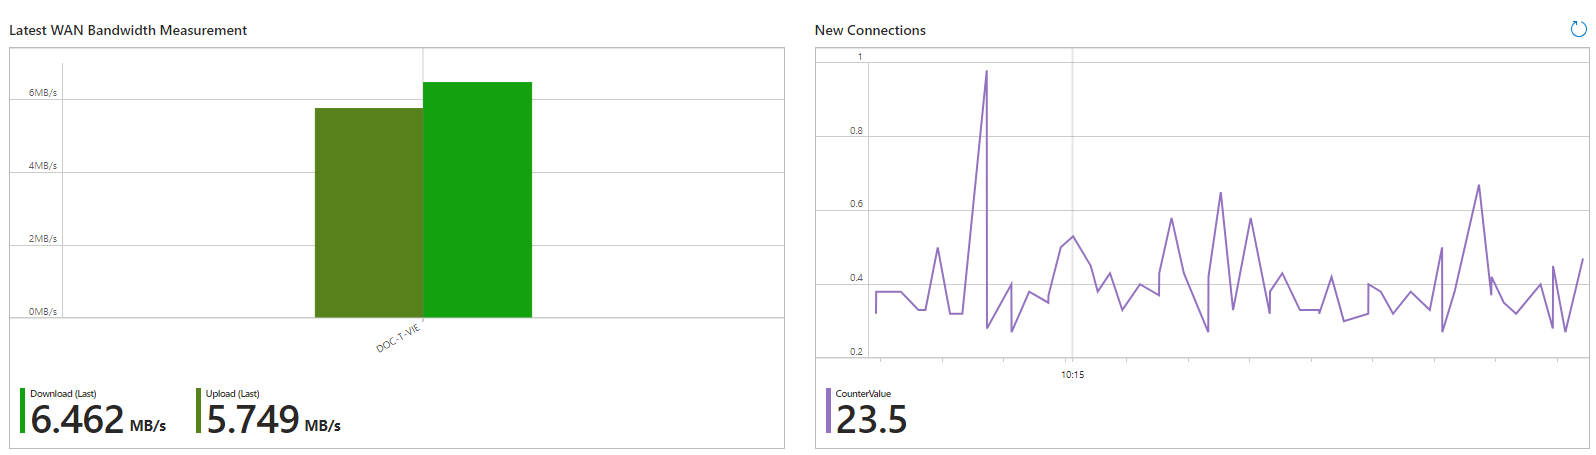
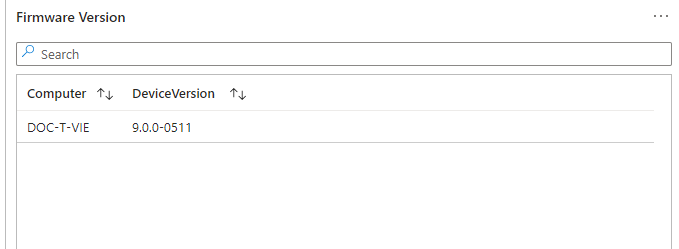
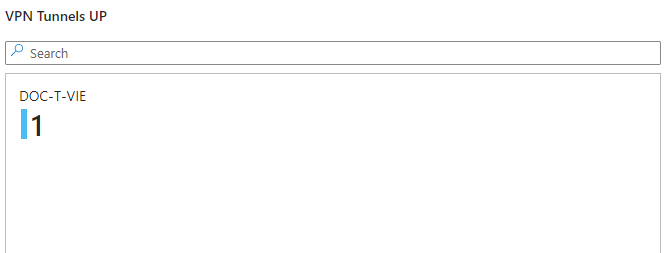
The Sites tab provides information on the load over a range of time, the latest WAN bandwidth measurements, and new connections. In addition, it displays information on the firmware version and the VPN tunnels currently up. In the Load over time illustration, you can see a graphical representation of the load during a specified time range. The Latest WAN Bandwidth measurement illustration provides a bar graph.
At the top of the workbook, click Sites. Select Sites and specify the Time frame from the drop-down list. The Sites page provides following details:
- Load over time.
Latest WAN Bandwidth measurement and New Connections.
- Site Device and Site CPU Temperature.
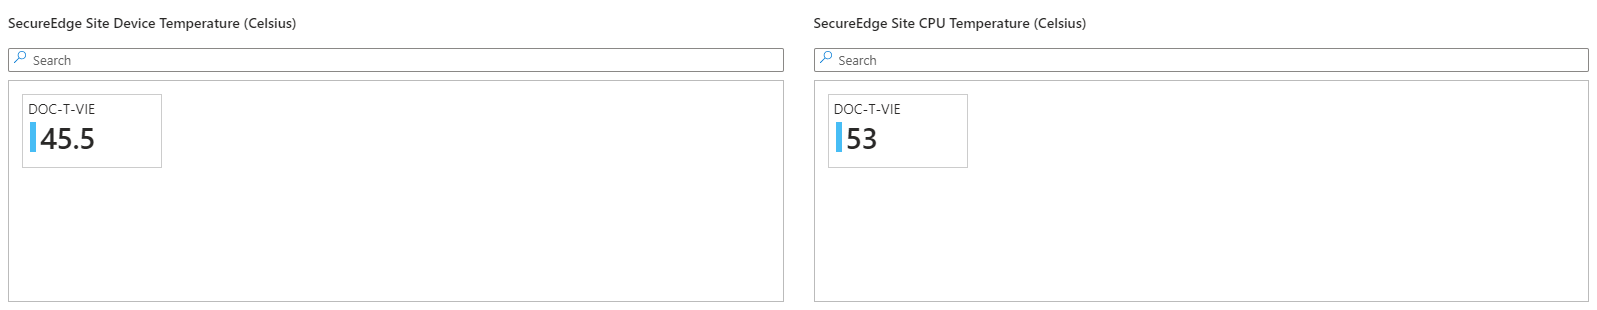
Firmware Version and VPN Tunnels UP.
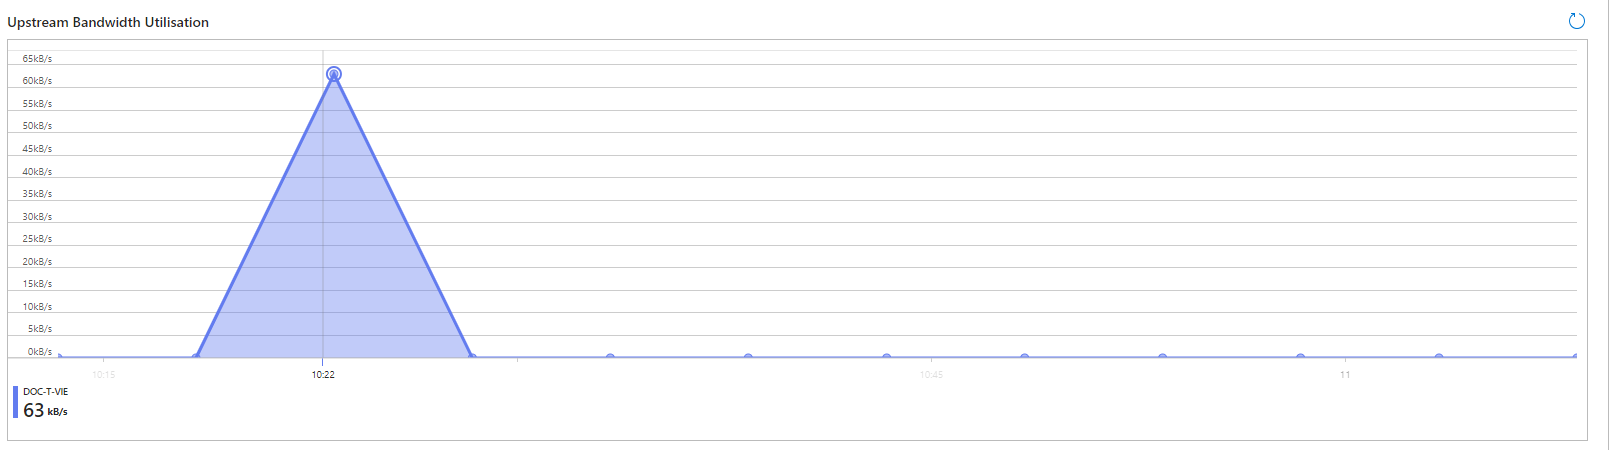
Accessing Information on the SD-WAN Page
The SD-WAN tab provides the aggregated data on latency, download bandwidth utilisation, and upstream bandwidth utilisation. Each of these elements provides an illustration of the data within a specified time range.
At the top of the workbook, click SD-WAN. Select Sites and specify the Time frame and Transport from the drop-down list. The SD-WAN page provides following details:
- Latency
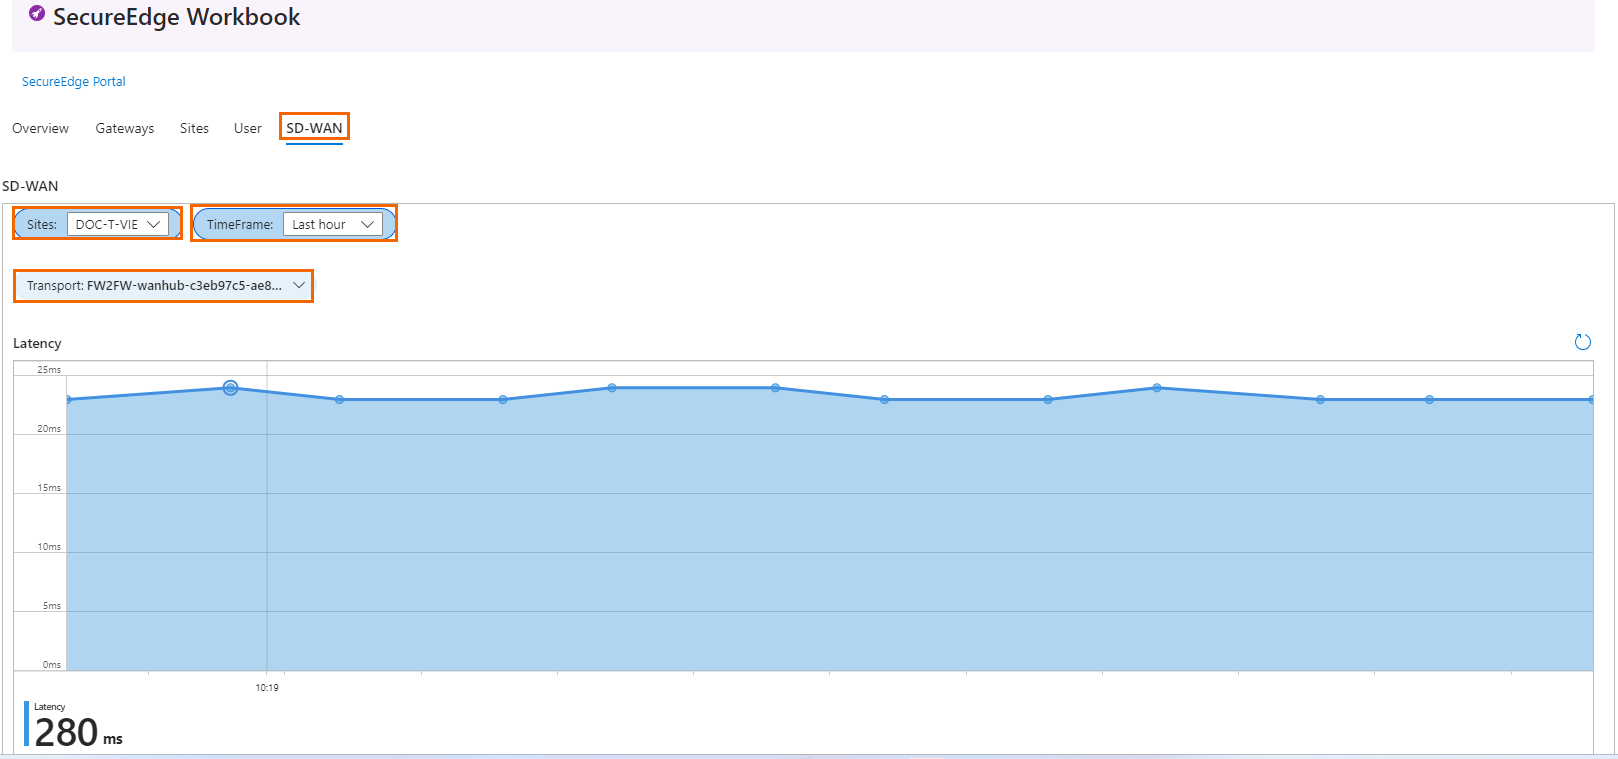
- Download Bandwidth Utilisation
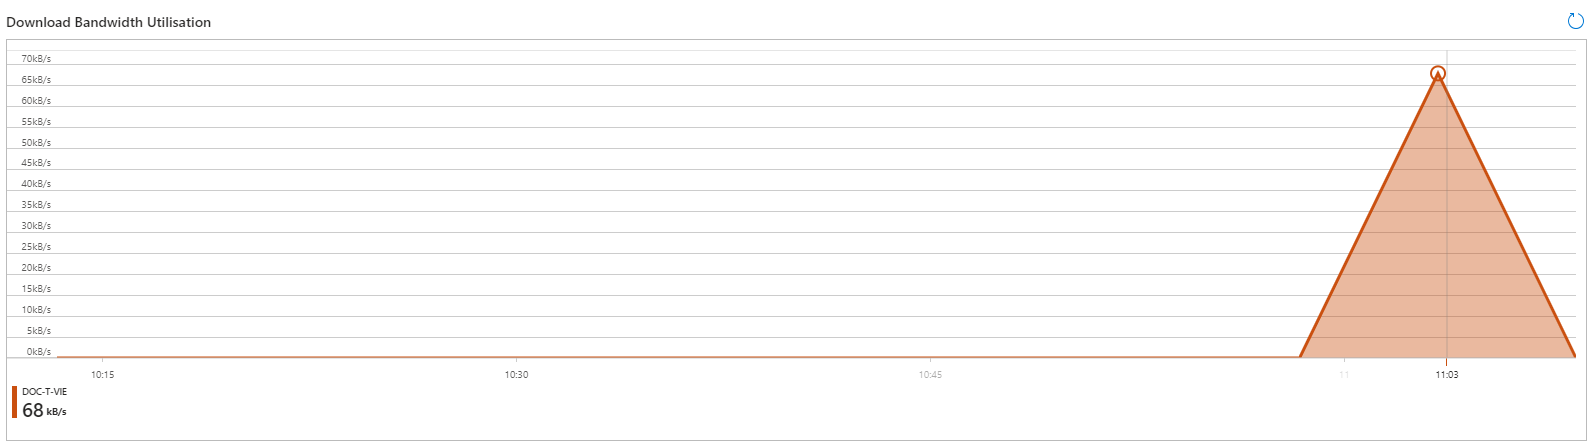
- Upstream Bandwidth Utilisation