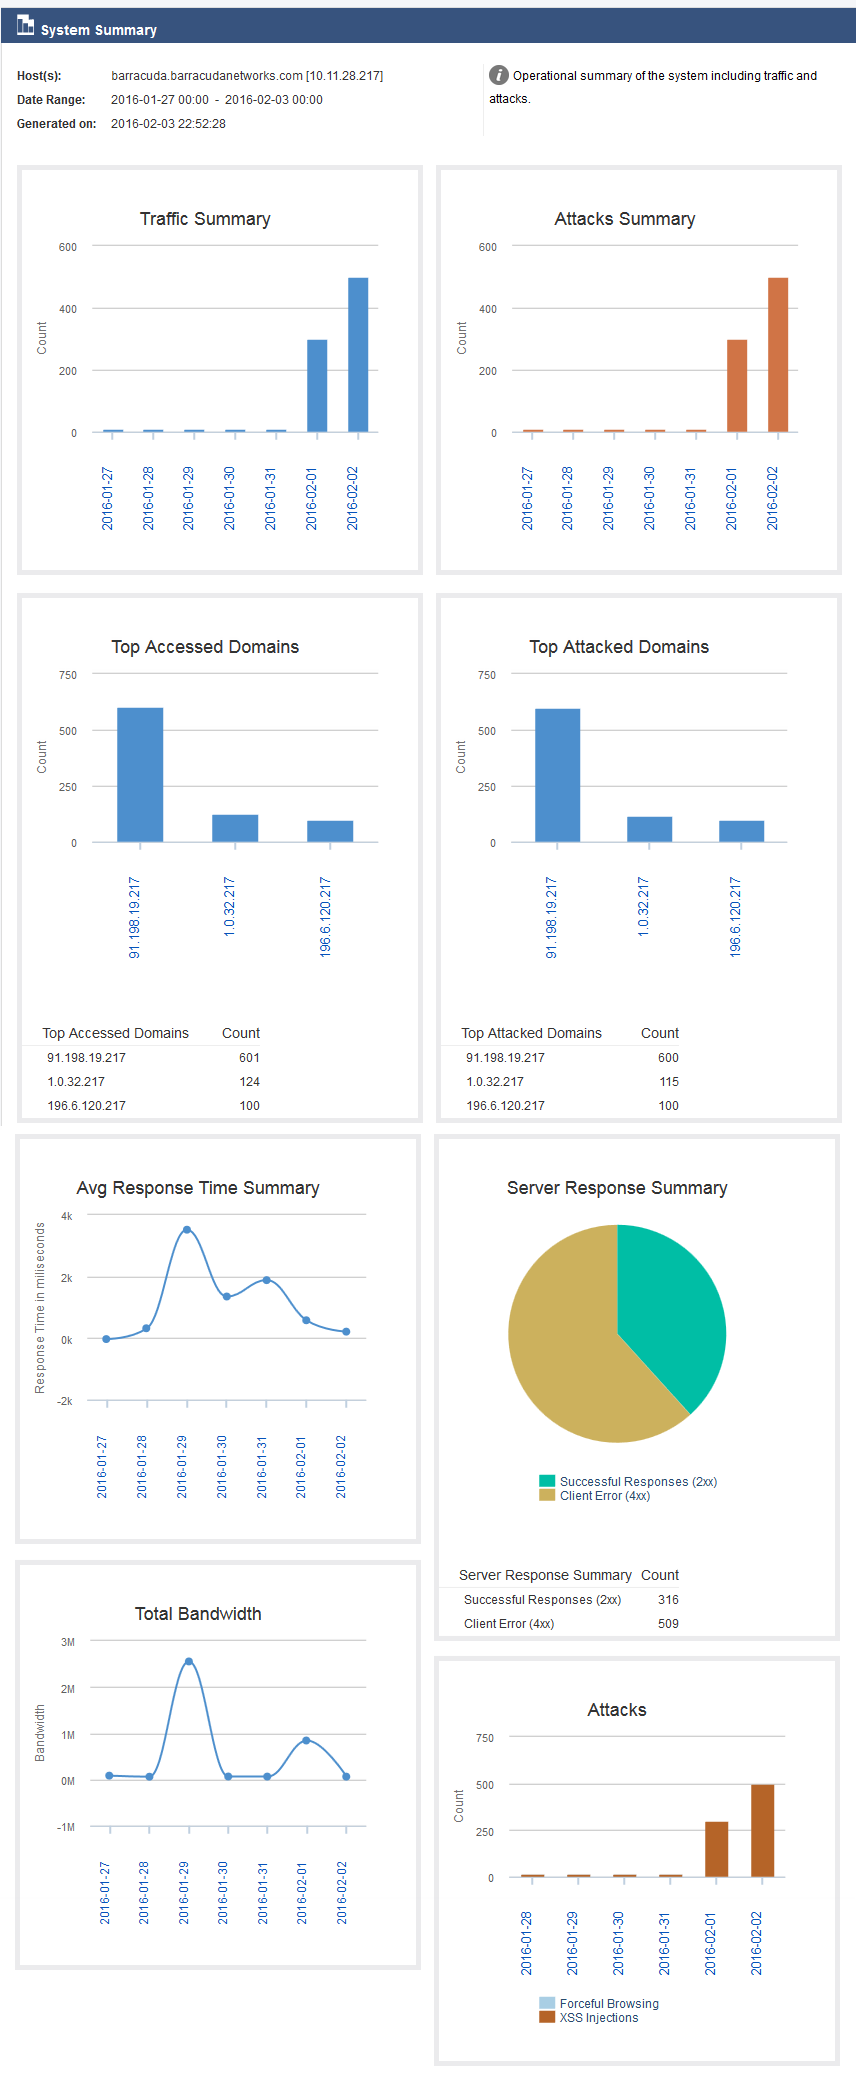
This report includes the operational summary of the system, including traffic and attacks. The System Summary report is a collection of the following sub-reports:
| Graph/Chart Name | Graph/Chart Type | Data in Graph/Chart |
|---|
| Traffic Summary | Column Chart | - X plots display the date and time in Year-Month-Date (i.e., YYYY-MM-DD) format.
- Y plots display the count of requests corresponding to each day.
|
| Attacks Summary | Column Chart | - X plots display the date and time in Year-Month-Date (i.e., YYYY-MM-DD) format.
- Y plots display the count of attacks corresponding to each day.
|
| Top Accessed Domains | Column Chart | - X plots display the accessed domain names based on the requests received.
- Y plots display the count of requests corresponding to each domain..
|
| Top Attacked Domains | Column Chart | - X plots display the name of attacked domains..
- Y plots display the count of attacks..
|
| Performance Summary | Line Chart | - X plots display the date in Year-Month-Date (i.e., YYYY-MM-DD) format
- Y plots display the response time (in milliseconds) corresponding to each day. .
|
| Server Response Summary | Pie Chart | Displays the distribution of HTTP response code (2xx, 3xx, 4xx, etc.) count in the pie chart. |
| Total Bandwidth | Line Chart | - X plots display the date in Year-Month-Date (i.e., YYYY-MM-DD) format
- Y plots display bandwidth usage corresponding to each day. .
|
| Attacks | Stack Column | - X plots display the date in Year-Month-Date (i.e., YYYY-MM-DD) format
- Y plots display the count of attacks corresponding to each day. .
|
Example of System Summary Report