

This section provides a description of each type of log on the Barracuda Web Application Firewall.
Web Firewall Logs
Web Firewall logs are generated whenever suspicious activities, as specified in the access control lists, are detected. The log contains entries for every HTTP request that the Barracuda Web Application Firewall has denied. This data allows the administrator to identify the client that made the request, the method used, and the result of the request. Using these logs, you can fine-tune the security settings. For more information, see Tuning Security Rules Using Web Firewall Logs.
When a service is created, the default web firewall policy is associated with the service, and the threshold for logging error messages is initially set to 5-Notice. At that threshold, all violations/error messages (critical attack information to debug information) are logged on the BASIC > Web Firewall Logs page. You can change the log level, based on your requirements, by editing service on the BASIC > Services page.
Access Logs
Access logs are generated for all user request patterns. Access logs allow you to monitor the web traffic that passes through the Barracuda Web Application Firewall for a specific user traffic pattern, or for a group of patterns. These logs provide information about website traffic and performance.
Access logs are enabled by default. To disable Access logs, edit the service on the BASIC > Services page and set Enable Access Logs to Off.
Audit Logs
Audit logs are generated whenever users log in or log out of the web interface of the Barracuda Web Application Firewall, except in a few rare cases:
The Login action is not logged when:
- The maintenance command is executed by a user or by the Barracuda Web Application Firewall. A new login session will be created in maintenance mode, but it will not be logged.
The Logout action is not logged, when:
- The Barracuda Web Application Firewall is restarted because critical processes have crashed, in which case the current existing sessions will not be logged out.
- The Maintenance command is executed by a user or by the Barracuda Web Application Firewall, in which case the current existing sessions will not be logged out.
System Logs
The System logs provide a centralized collection point for all types of error reports, system alerts, diagnostic messages, and status messages of the Barracuda Web Application Firewall. Both hardware and software components of the Barracuda Web Application Firewall generate System logs providing information about the problems and performance of a module. System logs are required for security and troubleshooting. System logs are enabled by default and are displayed on the ADVANCED > System Logs page.
Network Firewall Logs
The Network Firewall logs are generated whenever network traffic passing through the interfaces (WAN, LAN, and MGMT) matches a configured Network ACL rule. Network Firewall log entries provide information about each packet the Barracuda Web Application Firewall allowed or denied based on the Action specified in the ACL rule. This data allows the administrator to identify where network traffic originated, was destined for, and the action applied.
Filtering Log Entries
You can use filters to quickly locate specific types of log entries. The applied filter can be saved locally on the Barracuda Web Application Firewall for later use. A filter can be created with specific search criteria or multiple search criteria can be combined together with the help of the AND operator. The saved filters are displayed when Saved Filter is selected from the Select Filter drop-down list.
Whenever a log is generated in Web Firewall logs and Access logs, a unique ID (UID) is associated with the log. You can select the filter option ID and enter a unique ID to search for a specific log.
You can also specify the range for some of the filters, such as "Client Port" in BASIC > Web Firewall Logs, "Time Taken (ms)", "Client Port", "Bytes Sent", and "Bytes Received" in BASIC > Access Logs, "Source Port" and "Destination Port" in NETWORKS > Network Firewall Logs, and "Event ID" in ADVANCED > System Logs. The range should be specified with a <start value> and an <end value> separated by a comma (,). For example, the range for the client port can be specified as: 4000,7000.
Save a Filter with Specific Search Criteria
- Select the Custom radio button.
- Select a filter from the drop-down list. For example, the filter "ID" is selected from the drop-down list.
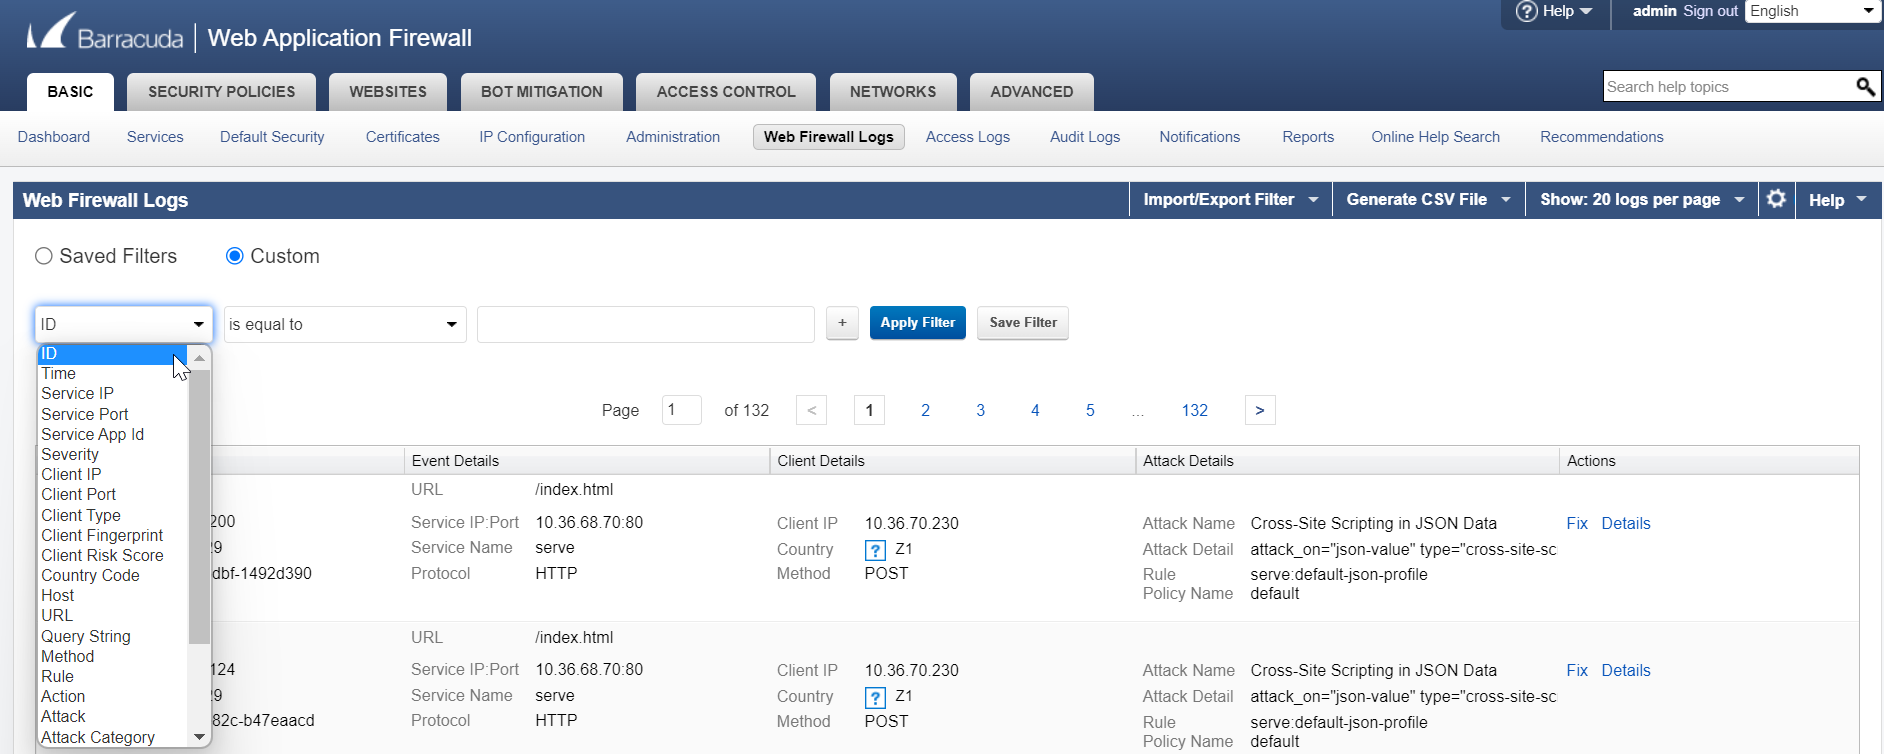
- Select an operator from the drop-down list, and then specify a value for the selected filter.
- Click the plus icon to add more search fields and click Save Filter. The Save Filter window appears.
- In the Save Filter window, enter a name for the filter, add a description, and click Save.
Save a Filter with Multiple Search Criteria
- Select a filter from the drop-down list. Click the plus icon to add more search fields.
- Select an operator from the drop-down list for all the filters and then specify a value for the filters. You can add multiple search criteria that can be combined together with the help of the AND operator.
- Click Save Filter. The Save Filter window appears.
- In the Save Filter window, enter a name for the filter, add a description, and click Save.
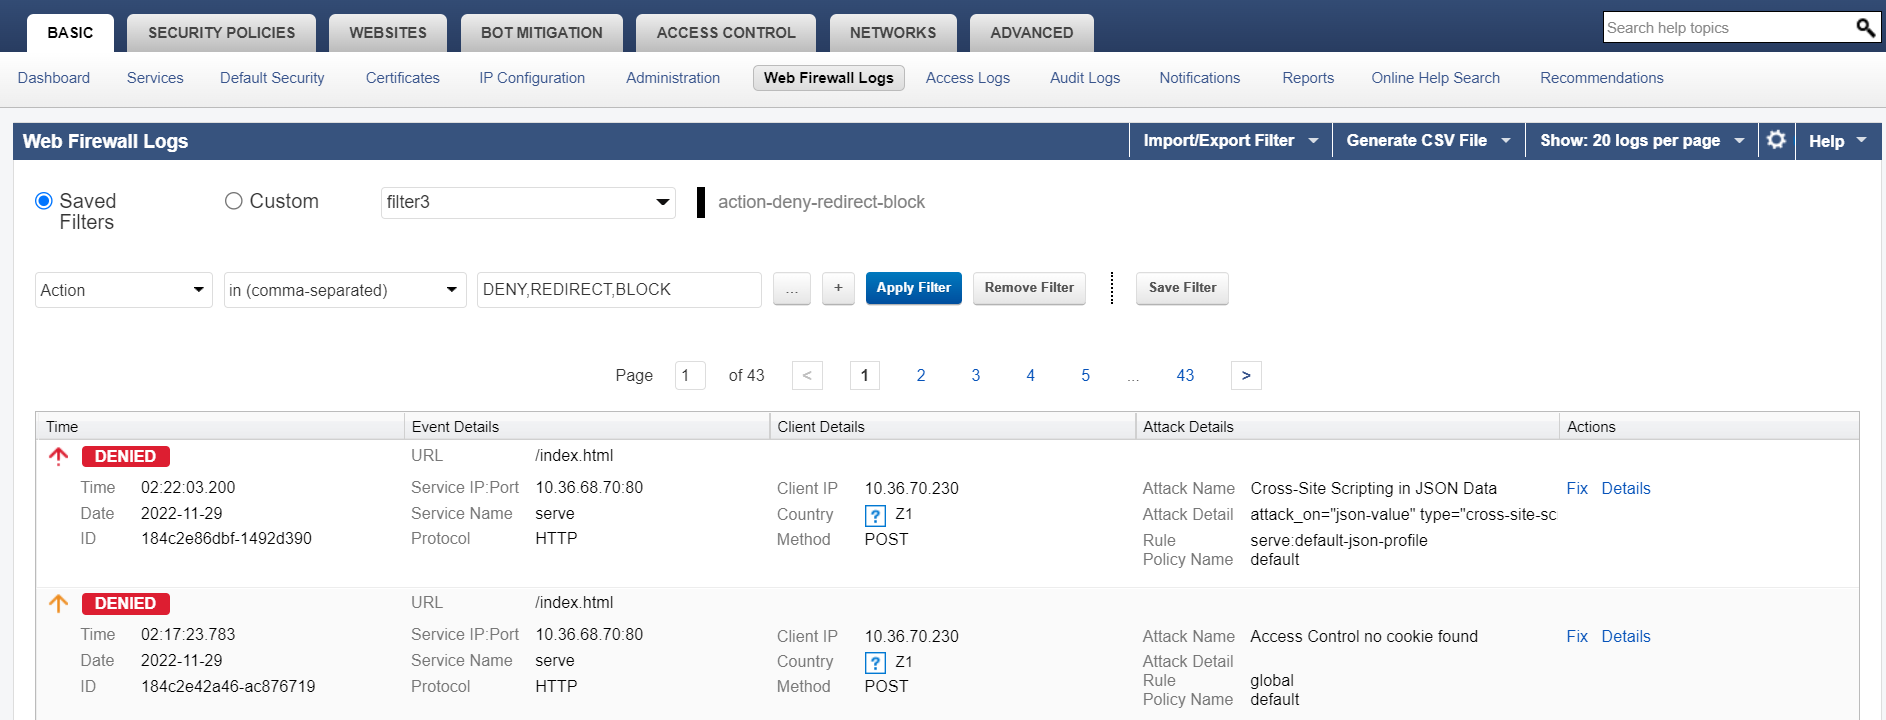
To apply a saved filter:
- Select Saved Filters radio button.
- Select the filter for which you want to view the logs from the Select Saved Filters drop-down list.
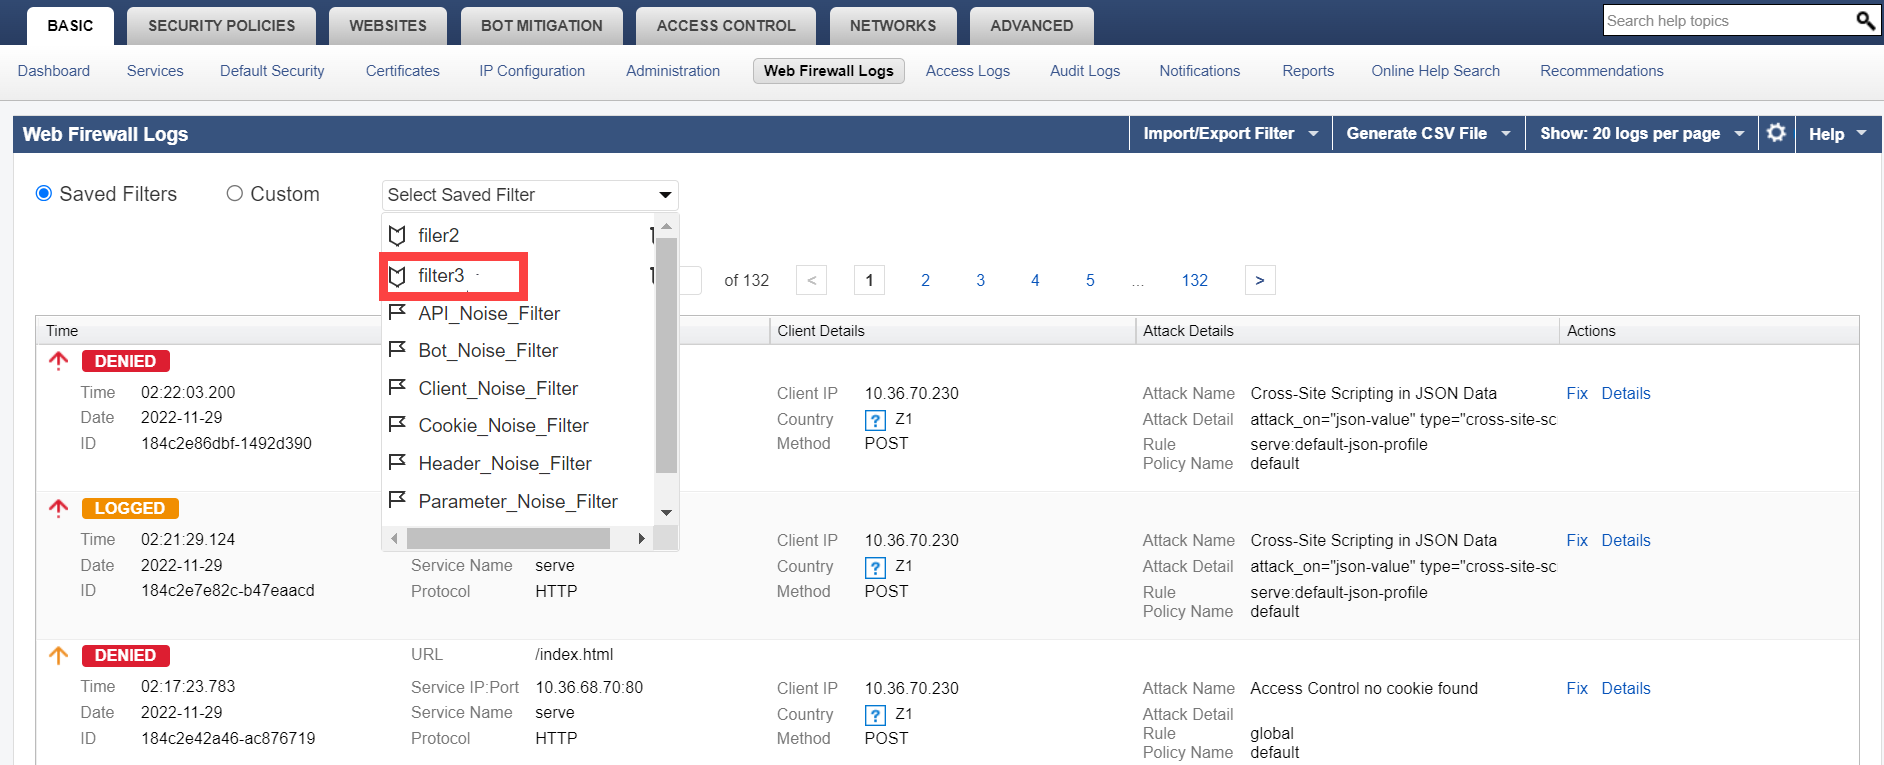
- Click Apply Filter.
Import a Saved Log Filter
- Click the Import/Export Filter drop-down list and select Import Log Filter. The Import Log Filter window appears.
- On the Import Log Filter window, do the following:
- Filter Name: Specify a name for the filter.
- Import File: Click Choose File to browse and select the log filter (JSON file) that needs to be imported.
- Click Import File.
- After the import is complete, the filter is applied, and the logs are displayed as per the filter.
Export a Saved Log Filter
- Click the Import/Export Filter drop-down list and select Export Log Filter. The Export Log Filter window appears.
- On the Export Log Filter window, do the following:
- Name: Click the Select Saved Filters drop-down list and select the filter that you want to export.
- Description: Provide the description for the filter.
- Filter: Review the filter details.
- Click Export Filter.
- After the download is complete, the filter is exported as a JSON file to your local machine.