Within Barracuda Cloud Control, use the Barracuda Appliance Control module to view and administer connected Barracuda Networks appliances.
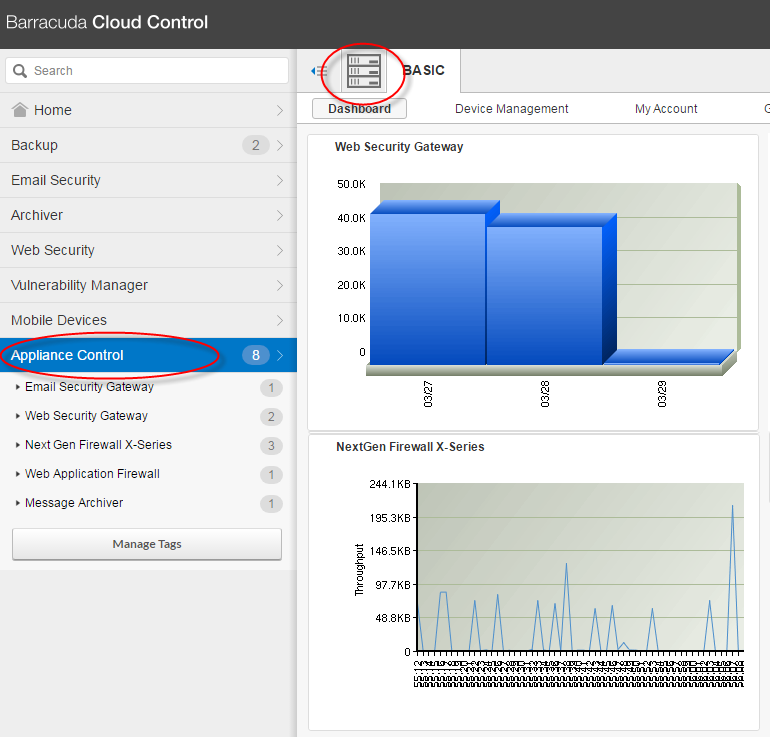
In the left panel, select Appliance Control. Check to make sure the Barracuda Appliance Control icon appears in the upper left of the screen. Here, you can view a summary of all devices connected to Barracuda Appliance Control, as shown in the figure below.
- Appliance Control Tree – In the left panel, under Appliance Control, the Appliance Control Tree shows each connected appliance is listed and tagged under the appropriate product type.
- Appliance Control Dashboard – The central portion of the page, the Appliance Control Dashboard displays small graphs of aggregated performance and traffic statistics for all connected devices, organized by device type, for the last 30 days.

Appliance Control Tree
In the Appliance Control Tree, you can select
- a single device, or
- multiple devices, by selecting:
- the group tag for a type of connected device, or
- multiple devices of the same device type
The statistics displayed in the Dashboard reflect your selection in the Appliance Control Tree. Note that statistics vary, based on device type.
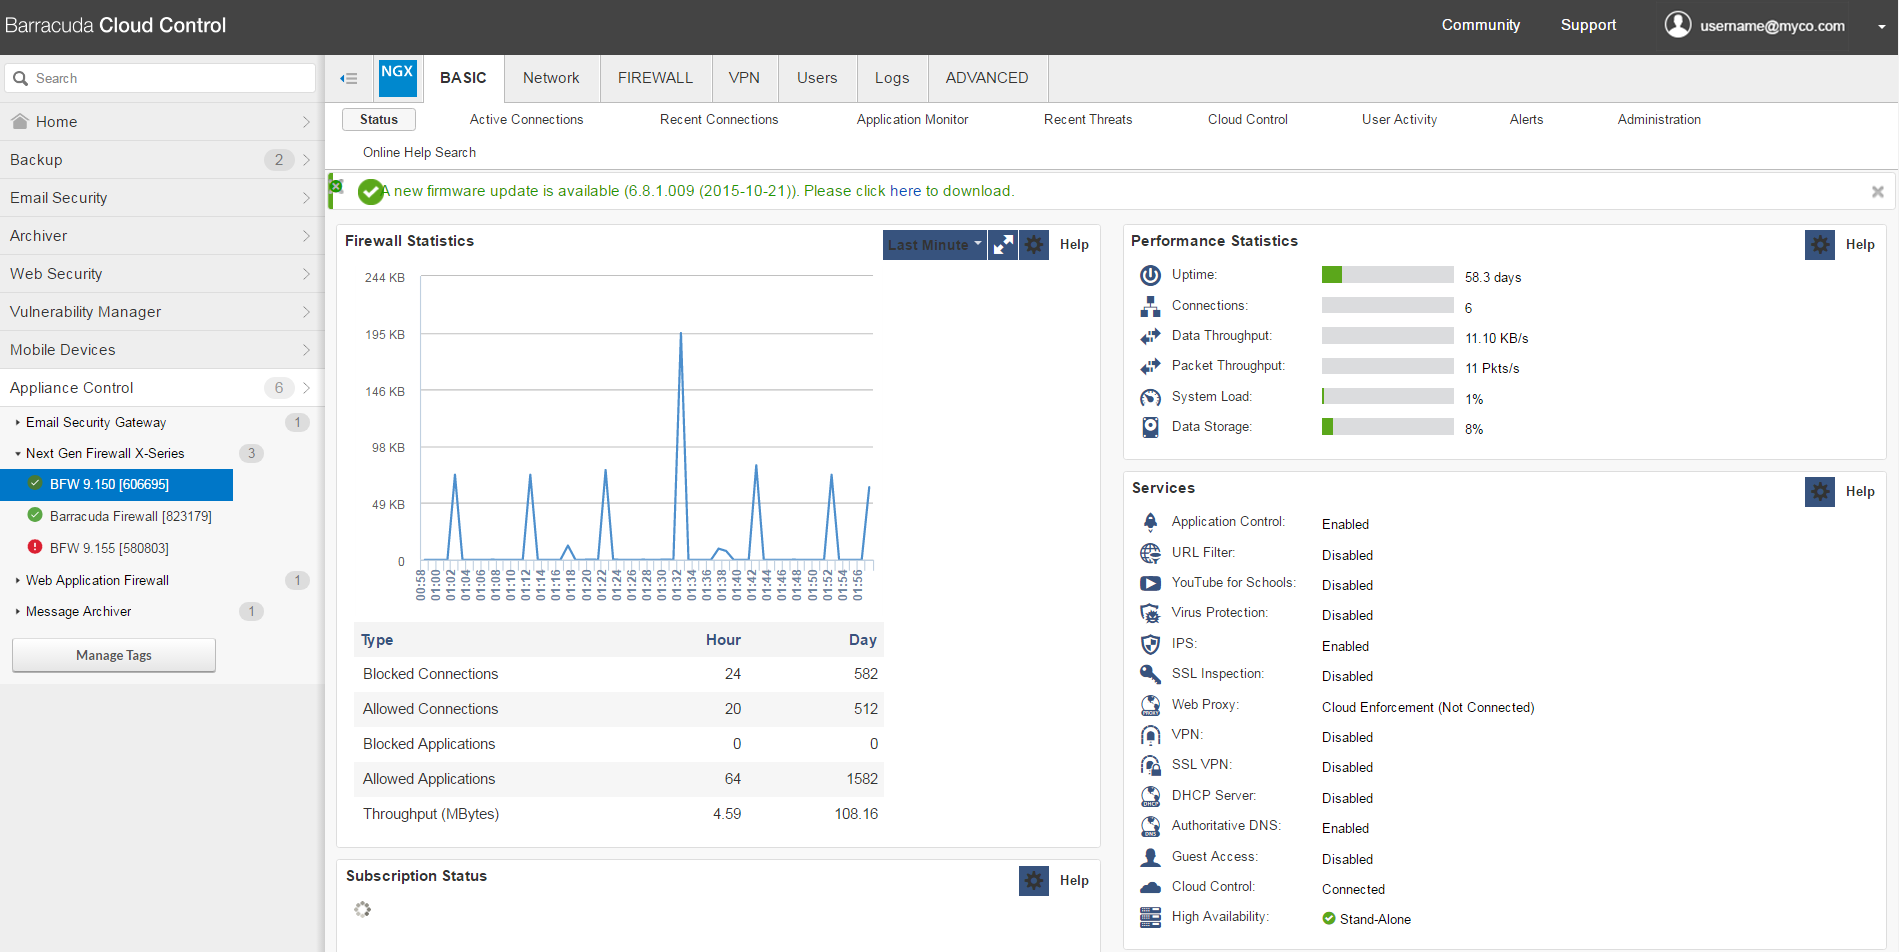
Product Context View – Select one specific device – Dashboard displays device statistics for that one specific connected device.
The figure below shows the Product Context View for just the BFW 9.150 device, selected in the Appliance Control Tree.
For additional details, refer to Product Context.

Product Context View
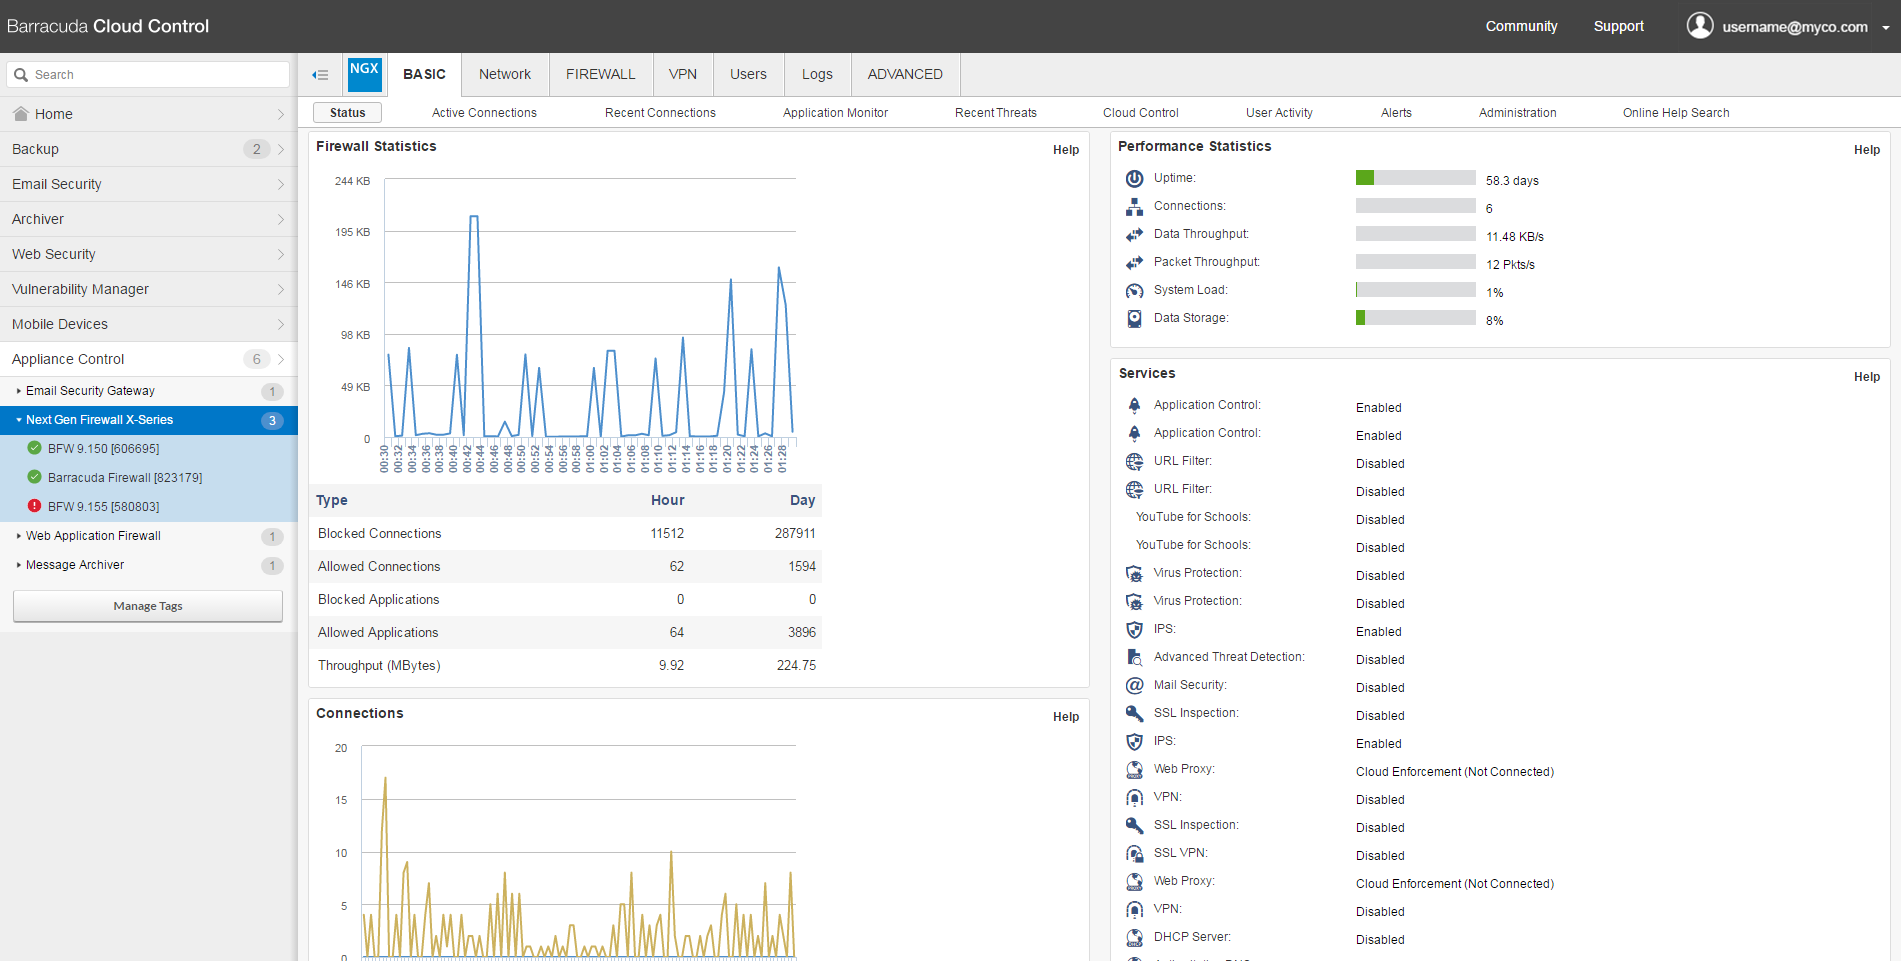
Group Context View – Select a device type tag or Select multiple devices of the same type – Dashboard displays collective statistics for all of the connected devices of that device type for that account.
The figure below shows the Group Context View, including aggregated information for all of the connected Next-Gen Firewall X-Series devices. Notice the differences between the data in the figure below and in the figure above.
For additional details, refer to Group Context.

Group Context View
Within Appliance Control, under the BASIC tab, you can use the following pages:

- Dashboard – Shows basic information for the product(s) that appear in the Appliance Control.
- My Account – Enables you to update some parts of your account.
- Group Management – Enables you to modify or delete groups.
- User Management – Enables you to manage some parts of user accounts.
- Audit Log – Displays log information for connected devices.
- Reports – Shows firmware versions installed on connected devices.
The Appliance Control Tree can contain the following products:
- Barracuda Email Security Gateway (info)
- Barracuda Web Security Gateway (info)
- Barracuda NextGen Firewall X-Series (info)
- Barracuda Web Application Firewall (info)
- Barracuda Message Archiver (info)
- Barracuda Load Balancer (info)
- Barracuda Link Balancer (info)
Status Icons
Colored status icons show the connection status of each device at a glance.
- A green checkmark
 next to a device name shows that the device is connected and is functioning normally.
 - A red exclamation point
 next to a device name means the device is either disconnected or otherwise unavailable.
Viewing Appliance Information in the Dashboard
Click a device name or group of devices to see status information in the Dashboard. Refer to Using the Dashboard for Connected Device Statistics.
Manage Tags
See the separate article for information on How to Use Tags to Organize Connected Appliances.
