The Firewall page displays information about the firewall traffic and services related to networking and firewalling. To access the Firewall page, click the DASHBOARD tab and select the Firewall icon in the ribbon bar.
The elements on the Firewall page provide the following information if the features are enabled:
- Security Services
- Networking Services
- Top Threats
- Top Threat Vectors
- Advanced Threat Protection
- Connections
- Top Live Applications
- Top Allowed Applications / Top Blocked Applications
- Top Allowed Users
- Top Allowed URL Categories / Top Blocked URL Categories
Security Services
This element displays the status (enabled or disabled) of security-related services on the Barracuda CloudGen Firewall. Click the arrow icon next to a feature to access the configuration. For information on how to enable security services, see How to Enable Application Control.
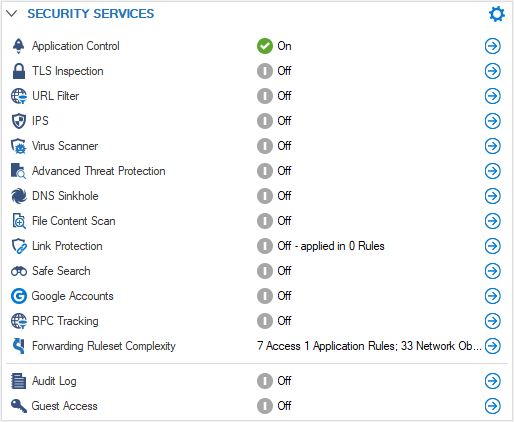
The Security Services element provides the following information:
- Application Control – Shows if Application Control is enabled on the CloudGen Firewall. For more information, see Application Control.
- TLS Inspection – Shows if TLS Inspection is enabled.
- URL Filter – Shows if the URL Filter is enabled. For more information, see URL Filter.
- IPS – Shows if the Intrusion Prevention System (IPS) is enabled. For more information, see Intrusion Prevention System (IPS).
- Virus Scanner – Shows if the Virus Scanner service is enabled. For more information, see Virus Scanner.
- Advanced Threat Protection – Shows if Advanced Threat Protection (ATP) is enabled. For more information, see Advanced Threat Protection (ATP).
- DNS Sinkhole – Replaces malicious domain responses with fake IP addresses. For more information, see How to Configure DNS Sinkholing in the Firewall.
- File Content Scan – Scan files for malicious content. For more information, see How to Configure File Content Filtering in the Firewall.
- Link Protection – Protect users from fraudulent links inside of plain-text and HTML emails. For more information, see How to Configure Link Protection for Mail Security in the Firewall.
- Safe Search – Shows if Safe Search is in use in the Forwarding Firewall ruleset. For more information, see How to Enforce SafeSearch in the Firewall.
- Google Accounts – This shows if the firewall filters traffic to Google services based on the domain attached to the Google Workplace account. For more information, see How to Configure Google Accounts Filtering in the Firewall.
- RPC Tracking – Shows if RPC tracking is enabled. For more information, see RPC Firewall Plugin Modules.
- Forwarding Ruleset Complexity – Shows the number of access and application rules, as well as the number of network objects.
- Audit Log – Shows if the firewall Audit Log service is enabled. For more information, see How to Enable the Firewall Audit Log Service.
- Guest Access – Shows if Guest Access is provided. For more information, see Firewall Authentication and Guest Access.
Networking Services
This element displays the status (enabled or disabled) of networking services. Click the arrow icon next to a feature to access the configuration.
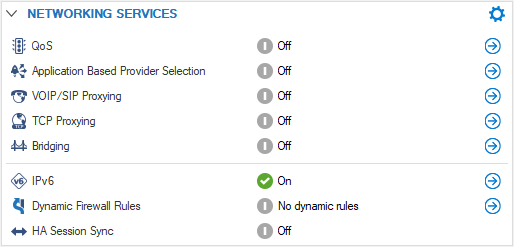
The Networking Services element provides the following information:
- QoS – Quality of Service. QoS is part of the CloudGen Firewall Traffic Shaping feature. For more information, see Traffic Shaping.
- Application Based Provider Selection – Shows if application-based provider selection is enabled. For more information, see Application Control.
- VOIP/SIP Proxying – Shows if VoIP/SIP proxying is enabled. For more information, see SIP Proxy.
- TCP Proxying – This shows if TCP proxying is enabled. For more information, see General Firewall Configuration.
- Bridging – Shows if bridging is enabled. For more information, see Bridging.
- IPv6 – Shows if IPv6 is enabled and in use. For more information, see IPv6.
- Dynamic Firewall Rules – Shows if dynamic firewall rules are enabled. For more information, see How to Create and Activate a Dynamic Access Rule.
- HA Session Sync – Shows if HA sync is active. If the number of pending sessions exceeds 7% of the active sessions, the HA session sync is displayed in a warning state (yellow).
Top Threats
This element shows the top threats by a number of incidents. Click the link on the top right of the element (Last Day) to change the time display interval. Click the tabs related to the feature to display information details.
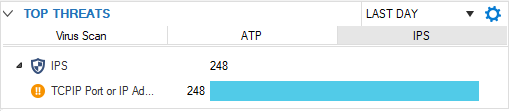
The Top Threats element provides the following information:
- Virus Scan – Shows the top threats detected by the Virus Scanner service, if enabled. For more information, see Virus Scanner.
- ATP – Shows the top threats detected by Advanced Threat Protection (ATP), if enabled. For more information, see Advanced Threat Protection (ATP).
- IPS – Shows the top threats detected by the Intrusion Prevention System (IPS), if enabled. For more information, see Intrusion Prevention System (IPS).
Top Threat Vectors
This element provides information on the top threat vectors sorted by user and geolocation.
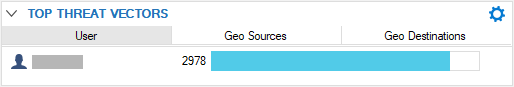
The User column indicates the number of errors stemming from an individual user. The Geo Sources column indicates the source country of an attack or a country that has been categorized as unsafe. The Geo Destinations column indicates the target country of an attack.
Advanced Threat Protection
If ATP is configured, the Advanced Threat Protection element displays the operational status of the ATP server.
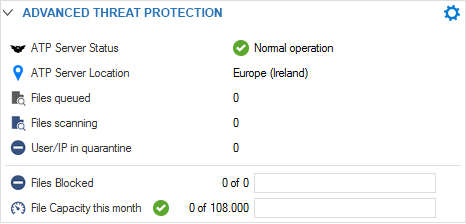
The status can be one of four possible options:


Connections
The Connections element shows the number of allowed and blocked connections on the CloudGen Firewall.
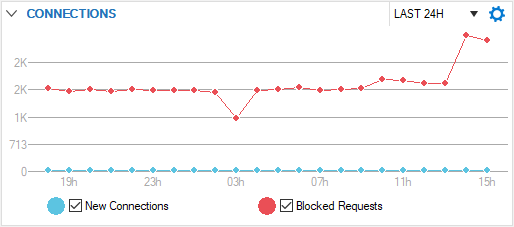
Click the link on the top right of the element (Last 24h) to change the time display interval, and select the checkboxes to toggle the display view.
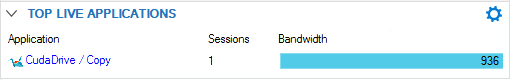
Top Live Applications
This element displays the currently transferred application and protocol traffic data per second and provides information on the clients causing the traffic.
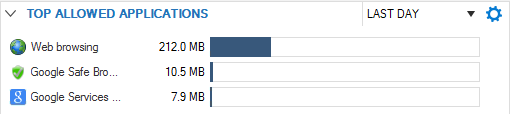
Top Allowed Applications
This element shows the top allowed applications by data size.
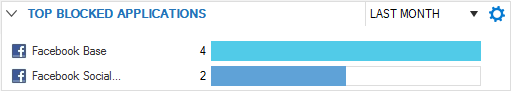
Top Blocked Applications
This element shows the top blocked applications by the number of occurrences.
Top Allowed Users
This element shows the top users by the data size.
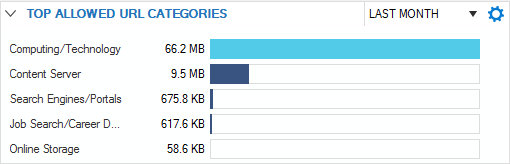
Top Allowed URL Categories / Top Blocked URL Categories
These elements show allowed and blocked URL categories sorted by data/occurrences.