The Barracuda SecureEdge dashboard provides a comprehensive overview of SD-WAN connections, network activity, and traffic details, and shows actionable status and security information of connected sites. SD-WAN provides multiple VPN transports with each transport capable of using a different WAN connection, thereby expanding on the concept of a traditional VPN tunnel with only one VPN transport to one logical VPN tunnel. SD-WAN also provides redundant, reliable, and failsafe network connections: the VPN tunnel is up and can transmit traffic as long as at least one transport is operational. Admins can retain full control over how each transport is used, or they can configure the advanced balancing and bandwidth management features to optimally use the available bandwidth. For more information, see SD-WAN Policies.
The SecureEdge smart dashboard consists of four predefined, customizable pages: A general dashboard named STATUS provides information on the status of all connected devices, a dashboard named SECURITY displays information on security cards, a dashboard named WEB FILTER displays information on secure web gateway cards, and a dashboard named ZERO TRUST ACCESS provides information on the status of connected users, resources, and custom applications. You can perform the following on your smart dashboard:
- You can change the dashboard appearance as well as the displayed information per workspace.
- You can move (drag-and-drop) and modify each element as needed.
- You can create, modify, or delete your own customize dashboards and save them.
STATUS Dashboard
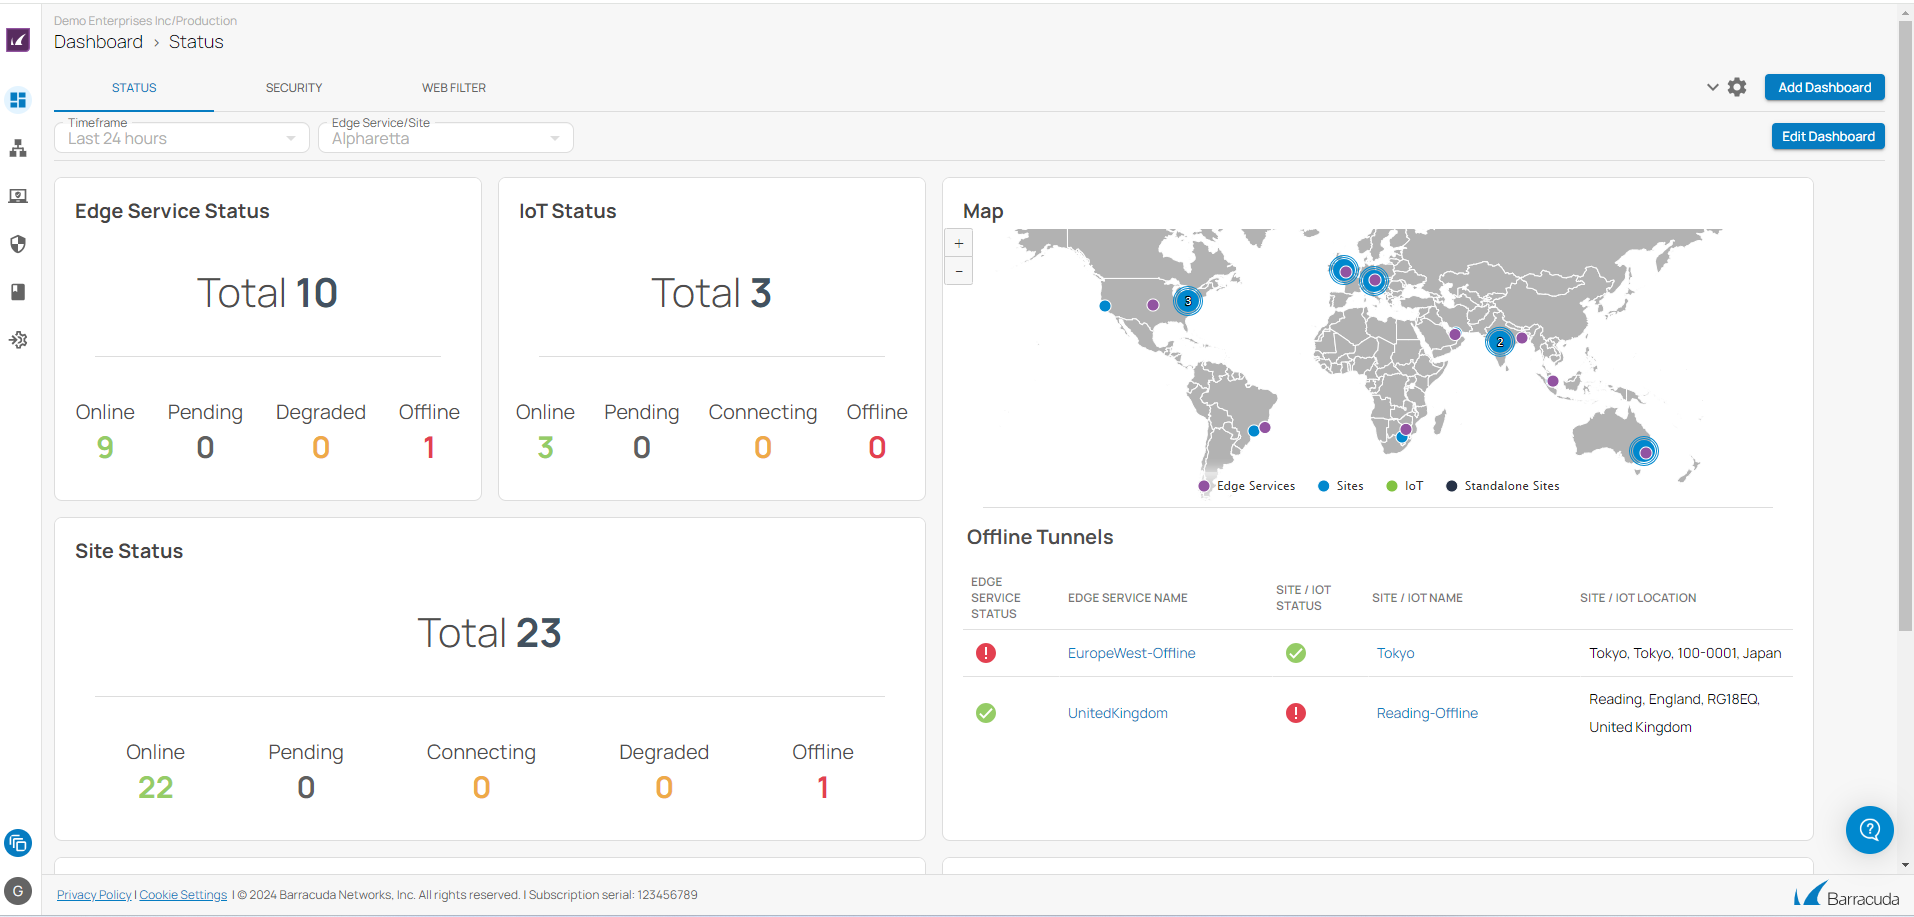
The Barracuda SecureEdge STATUS dashboard provides an overview of all connections, and shows the network status, events, as well as the actionable status and security information of connected edge services, sites, and IoT devices. You can move (drag-and-drop) and modify each element according to your requirements. You can create, modify, or delete your own customize dashboards and save them.
The dashboard organizes information into elements and provides the following details:
Map
The appliance map provides a graphical view of active VPN tunnels and shows all connected sites, edge services, and IoT devices based on their geo-location.
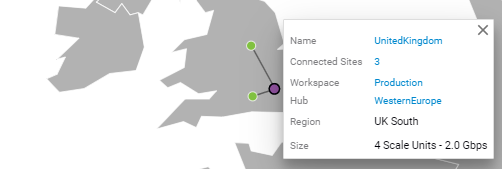
Click on a location to view more details for the connected site, service, or device.
Status of Edge Service, Site, and IoT
These elements list all connected edge services, sites, and IoT devices in total and provide information on the individual connection status. Enrolled units are shown in numbers with their status indicated by colors:
- Online – Edge service, site, or IoT device is up and running.
- Pending – Edge service, site, or IoT device is waiting for updates.
- Connecting – Edge service, site, or IoT device is trying to connect.
- Degraded – Connection is degraded.
- Offline – Connection is down.
To distinguish between the status of various enrolled units, different colors are used:
- Green – Connection to the appliance is online, and the appliance is up and running.
- Yellow – Connection to the appliance is degraded.
- Orange – Currently connecting to the appliance.
- Gray – Connection to the appliance is pending and waiting for updates.
- Red – Connected appliance is offline.
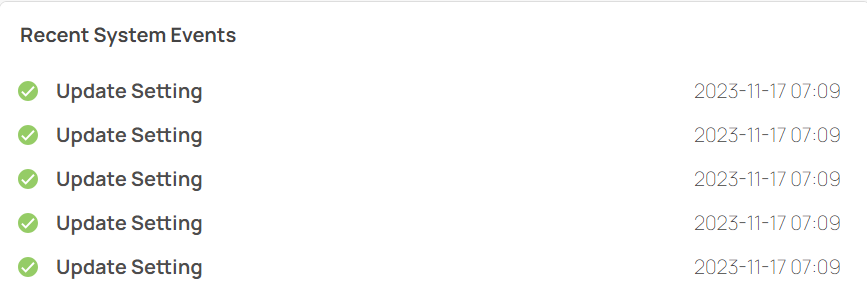
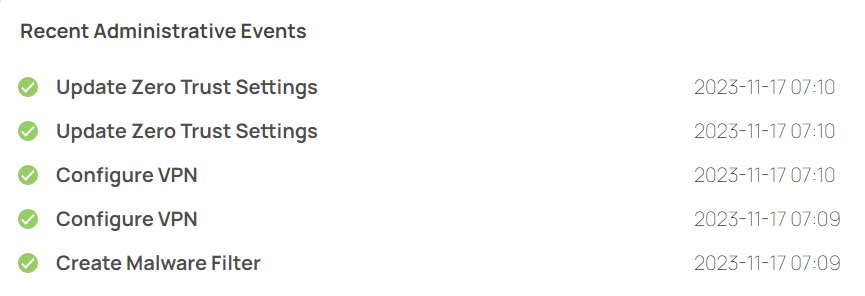
Events
The Events element provides details on recent events related to system status and administration.
 |
|
Offline Tunnels
The Offline Tunnels element provides information on all offline tunnels.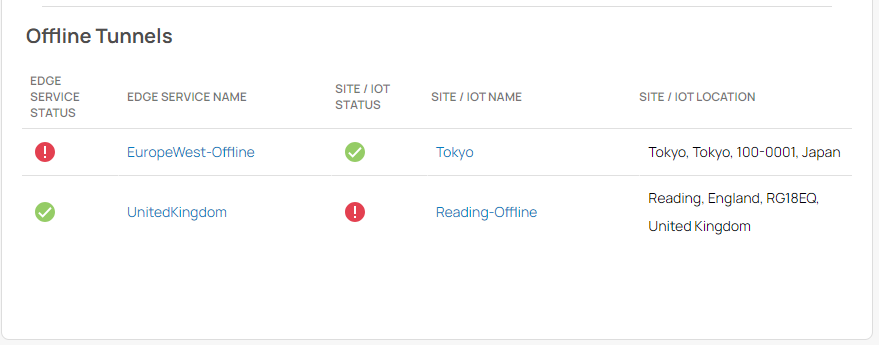
Click on an entry to open the corresponding configuration window. For information on how to configure edge services, devices, and sites, see Deployment and Getting Started.
SECURITY Dashboard
The Barracuda SecureEdge SECURITY dashboard displays security information. The security information can be added by adding various available widgets or cards. To access information on the security dashboard:
- Go to https://se.barracudanetworks.com and log in with your existing Barracuda Cloud Control account.
- In the left menu, click the Tenants/Workspaces icon and select the workspace you want to access information on the dashboard for.
- Click SECURITY DASHBOARD.
- The Security dashboard page opens. Specify the values for the following:
- Timeframe – Select the desired time frame from the drop-down list. You can choose between Last 24 hours, Last week, Last month, or Last 3 months.
- Edge Service / Site – Select the edge service or site from the drop-down list.
- With respect to your desired time frame for a selected site or edge service, you can see a graphical representation of the status of all added security widgets/cards.
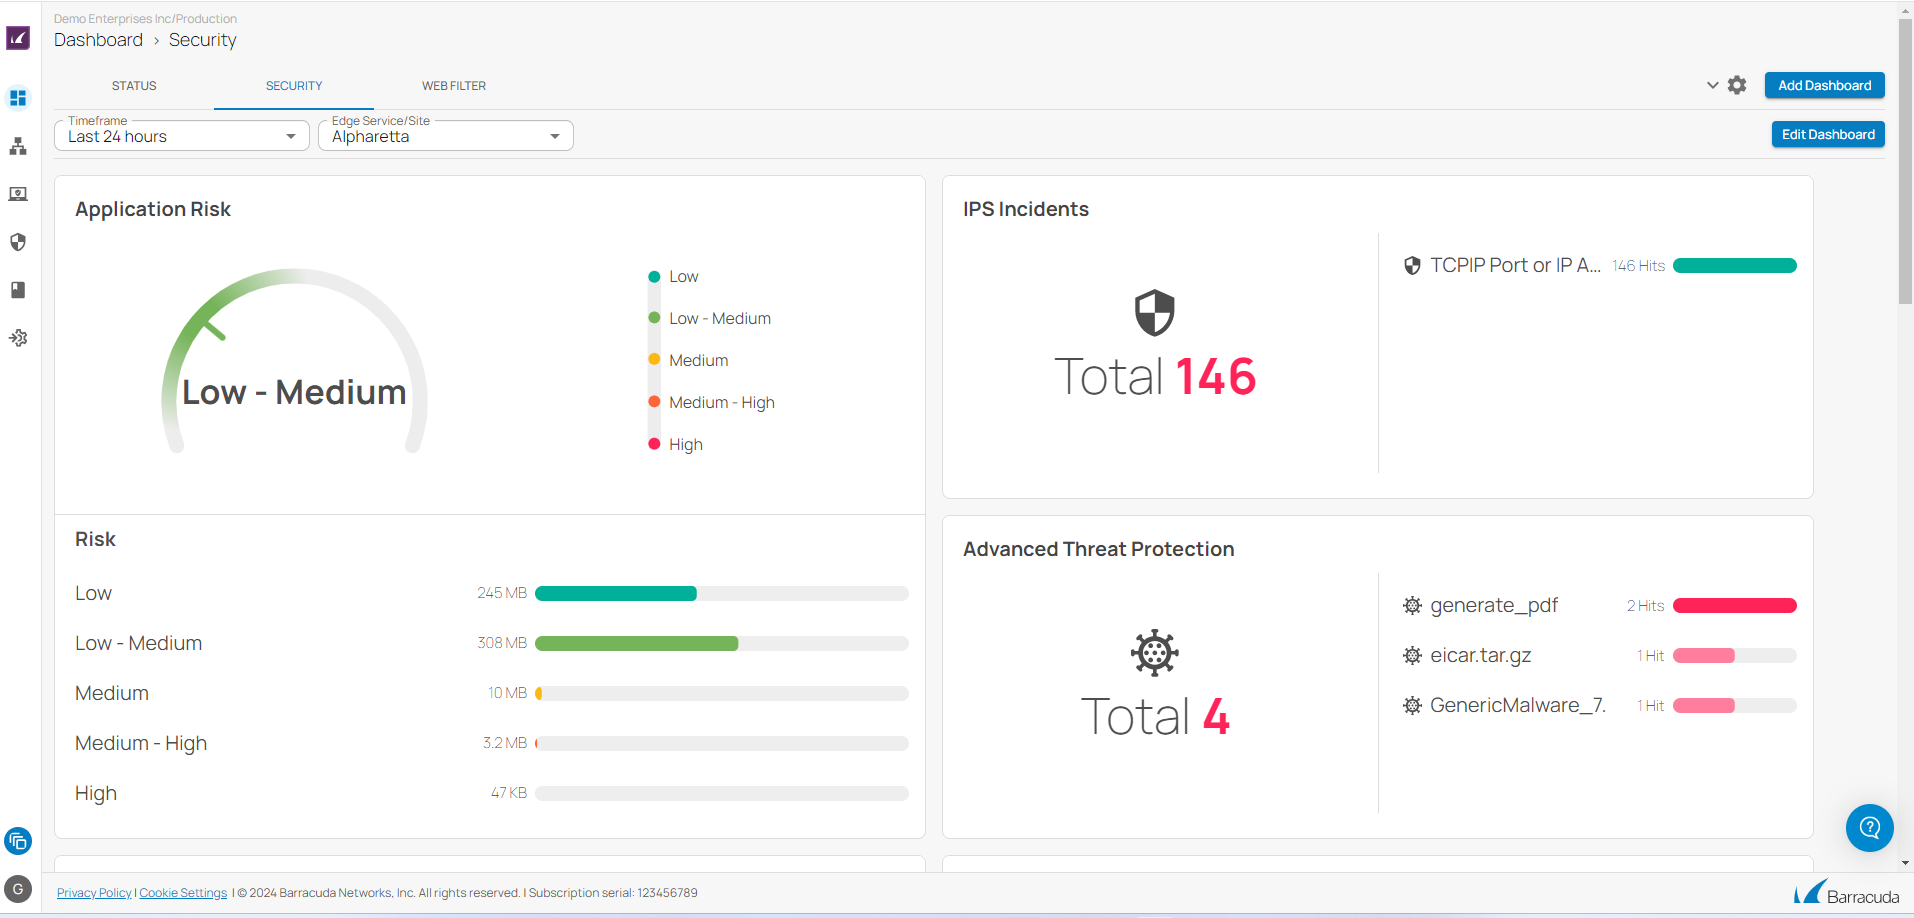
The elements on the SecureEdge SECURITY dashboard provide the following details:
- Application Risk
- Risk
- IPS Incidents
- Advanced Threat Protection
- Top Blocked Applications
- Top Allowed Applications (per Traffic)
- Top Geo Destination Countries
- Top Allowed App Categories (per Traffic)
- Top Geo Source Countries
- Top Blocked Users
- Top Users
WEB FILTER Dashboard
The Barracuda SecureEdge WEB FILTER dashboard provides information on secure web gateway cards/widgets. It also displays various top-traffic dashboard widgets such as allowed or blocked URL categories, allowed or blocked domains, and top users. To access information on the WEB FILTER dashboard:
- Go to https://se.barracudanetworks.com and log in with your existing Barracuda Cloud Control account.
- In the left menu, click the Tenants/Workspaces icon and select the workspace you want to access information on the dashboard for.
- Click WEB FILTER DASHBOARD.
- The Web Filter dashboard page opens. Specify the values for the following:
- Timeframe – Select the desired time frame from the drop-down list. You can choose between Last 24 hours, Last week, Last month, or Last 3 months.
- Edge Service / Site – Select the edge service or site from the drop-down list.
- With respect to your desired time frame for a selected site or edge service, you can see a graphical representation of the status of all added widgets/cards.
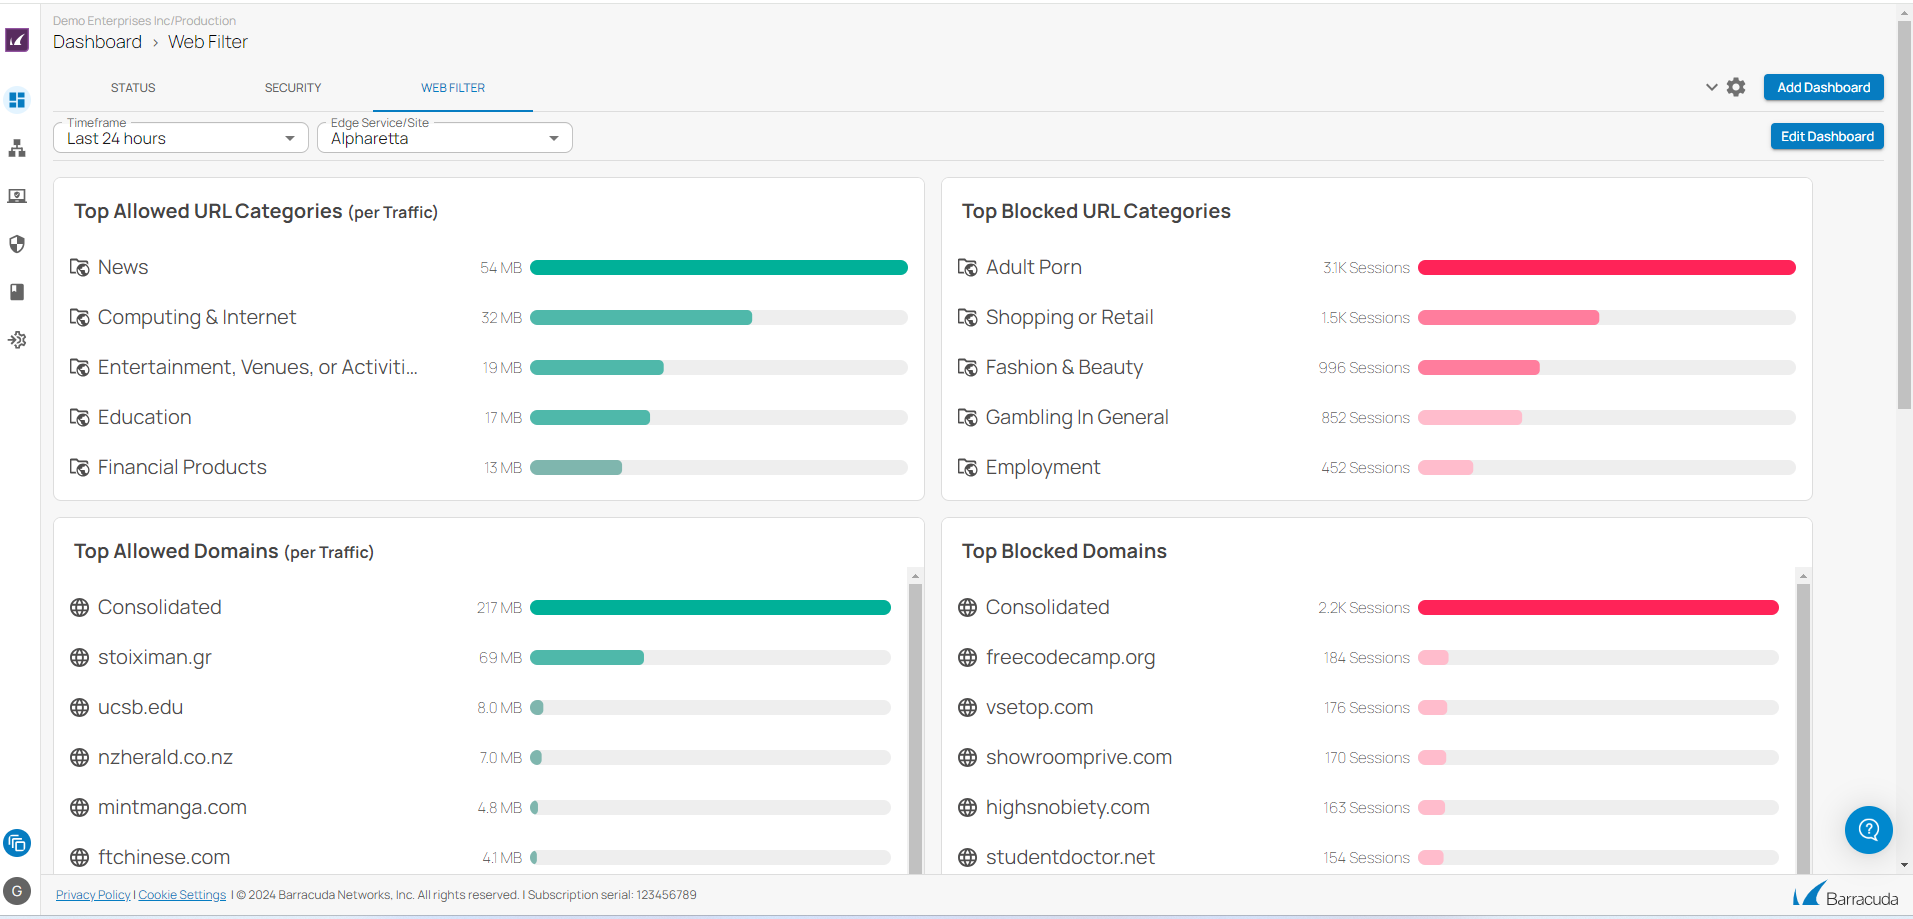
The elements on the SecureEdge WEB FILTER dashboard provide the following details:
- Top Allowed URL Categories (per Traffic)
- Top Blocked URL Categories
- Top Allowed Domains (per Traffic)
- Top Blocked Domains
- Top Users
- Top Blocked Users
ZERO TRUST ACCESS Dashboard
The Barracuda SecureEdge ZERO TRUST ACCESS dashboard displays information on the status of connected users, resources, and custom applications. The Zero Trust Access information can be added by adding various available widgets or cards. To access information on the ZTA dashboard:
- Go to Dashboard > ZERO TRUST ACCESS.
- The Zero Trust Access dashboard page opens. Specify the values for the following:
- Timeframe – Select the desired time frame from the drop-down list. You can choose between Last 24 hours, Last week, Last month, or Last 3 months.
- Edge Service / Site – Select the edge service or site from the drop-down list.
- With respect to your desired time frame for a selected site or edge service, you can see a graphical representation of the status of all added widgets/cards.
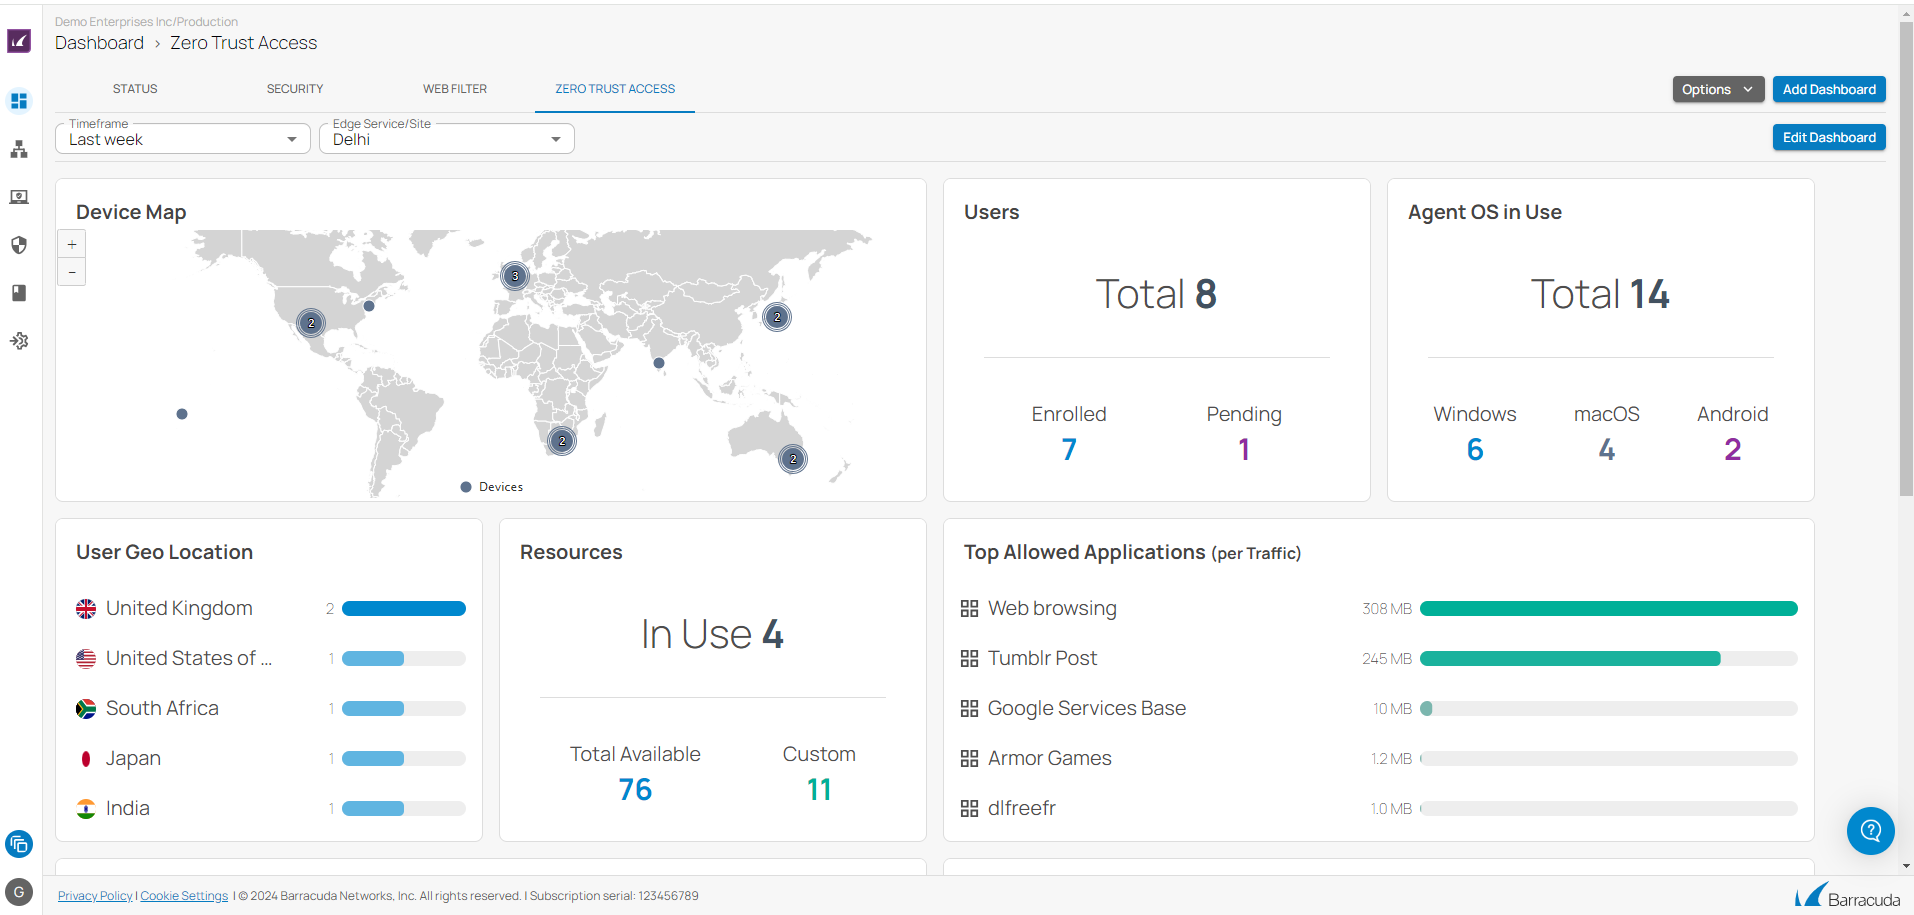
The elements on the SecureEdge ZERO TRUST ACCESS dashboard provide the following details:
- Users
- Agent OS in Use
- User Geo Location
- Resources
- Top Allowed Applications (per Traffic)
- Top Allowed URL Categories (per Traffic)
- Top Allowed Domains (per Traffic)
- Agent Version in Use
- Top Version in Use
- Device Map
For more information, see How to Customize a SecureEdge Zero Trust Access Dashboard.
Additional Information
Accessing Information on the Edge Services Dashboard
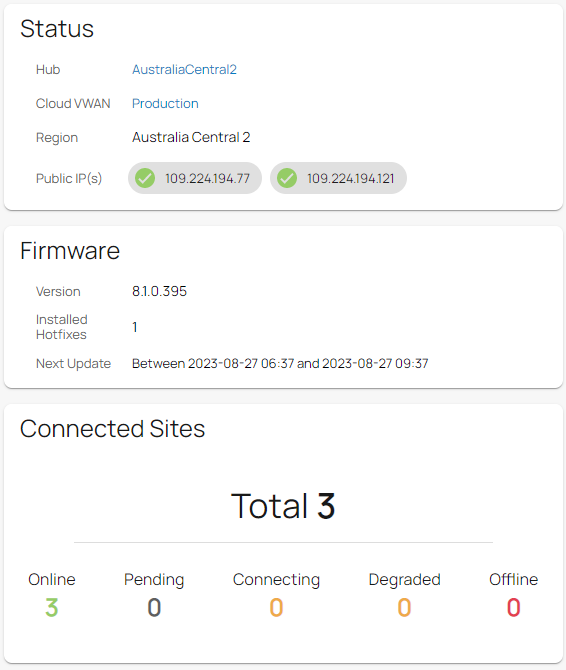
The SecureEdge Edge Services page gives you an overview of all connected edge services for virtual WAN and private edge. The edge service for the virtual WAN dashboard provides aggregated data on each element of the connected edge service, such as status, firmware, and connected sites and IoT devices.
To access the edge service for the Virtual WAN page, select your workspace, go to Infrastructure > Edge Services and click on the arrow icon next to the edge service you are interested in. The Edge Service Dashboard page provides following details:
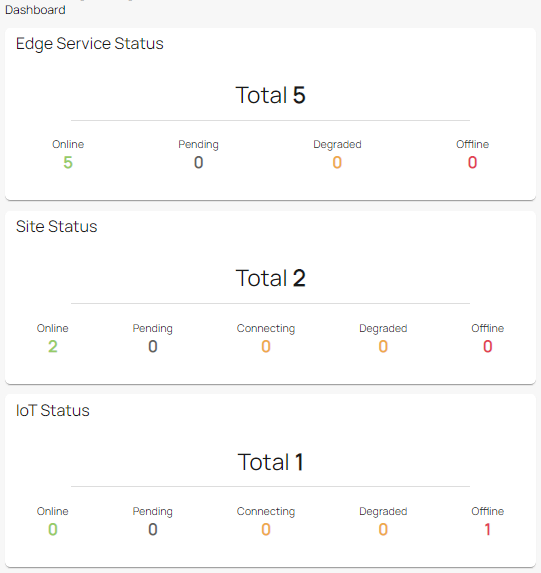
- Status – The Status element displays the status of the connected edge service for Virtual WAN.
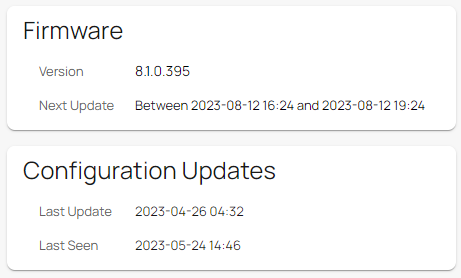
- Firmware – The Firmware element displays the installed software version and hotfixes, and provides the time period for the next updates.
- Connected Sites – The Connected Sites element displays all connected sites in total and provides information on the individual connection status.
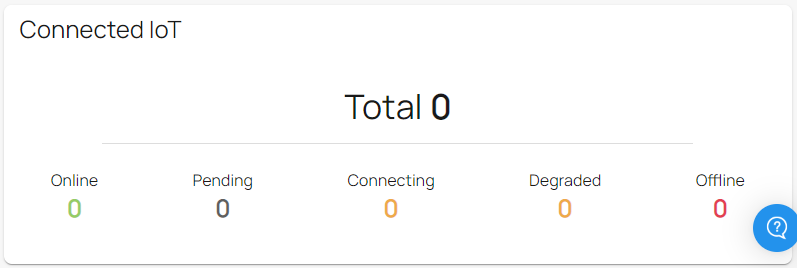
- Connected IoT – The Connected IoT element displays all connected IoT devices in total and provides information on the individual connection status.
To access the Private Edge page, select your private Edge Service and repeat the corresponding steps. The Private Edge dashboard displays more elements in addition to the elements listed above. These elements are as follows:
- Licenses – The Licenses element displays information on the status of current licenses.
- Hotfixes – The Hotfixes element displays the status of current hotfixes for each connected private edge.
- Configuration Updates – The Configuration Updates element displays details about your configuration updates.
- Services – The Services element displays the status of services running on your private edge.
- Interfaces – The Interfaces element displays the status of network interfaces connected to your private edge.
- Resources – The Resources element displays details about the real-time usage of your system's resources.
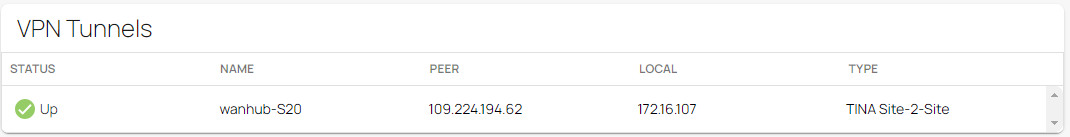
- VPN Tunnels – The VPN Tunnels element displays the status of all VPN tunnels connected to your private edge.
Accessing Information on the SITE Dashboard
The SecureEdge SITE dashboard provides a comprehensive overview of each element of a connected site or sites.
To access the SecureEdge Site page, first select your workspace, go to Infrastructure > Sites, and click on the arrow icon next to the site you are interested in. The SecureEdge Site Dashboard page provides following details:
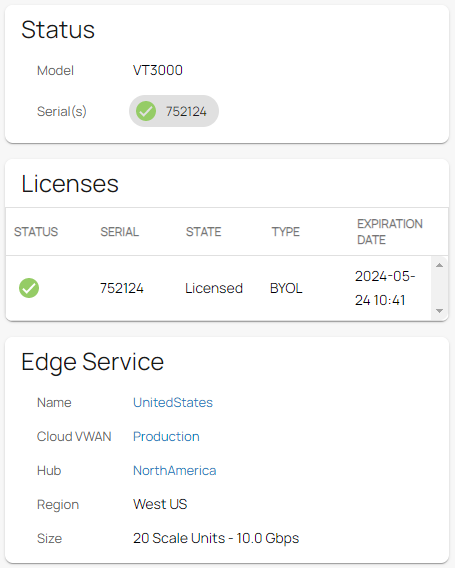
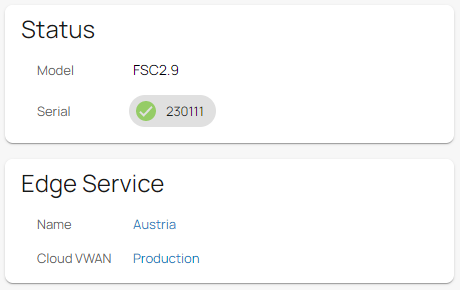
- Status – The Status element displays the status of the connected site or sites.
- Licenses – The Licenses element displays information on the current status, state, serial number, type, and expiration date of your licenses.
- Edge Service – The Edge Service element displays information on each connected edge service.
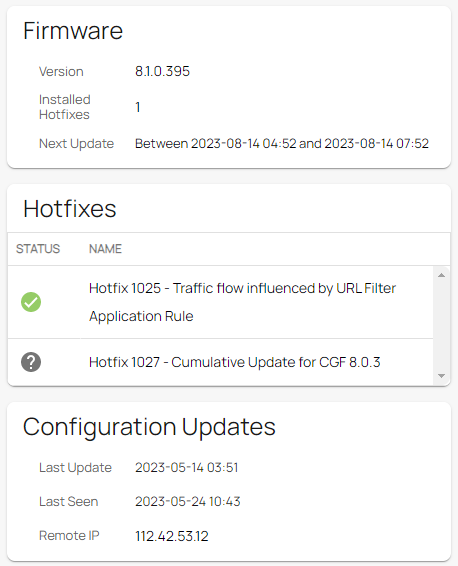
- Firmware – The Firmware element displays the installed software version and hotfixes, and provides the time period for the next update of your site or sites.
- Hotfixes – The Hotfixes element displays the status of current hotfixes for your connected site or sites.
- Configuration Updates – The Configuration Updates element displays information on configuration updates, such as last update, last seen, and your remote IP.
 |
|
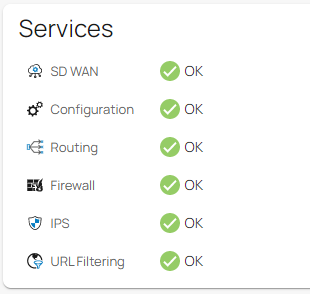
- Services – The Services element displays the status of all available services running on the connected site, such as SD-WAN, configuration, routing, firewall, IPS, and URL filtering.
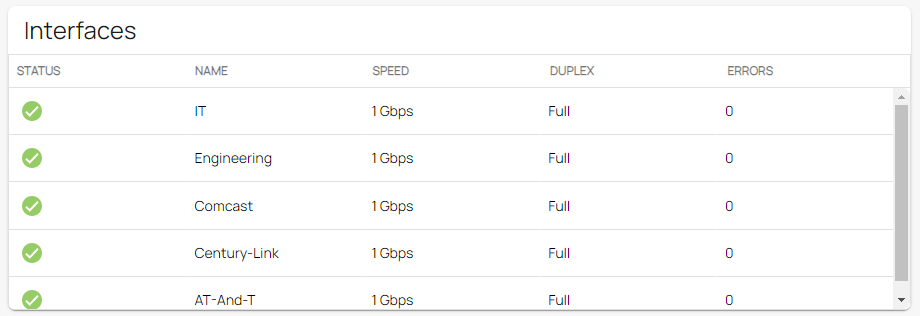
- Interfaces – The Interfaces element provides an overview on the status of all network interfaces connected to your sites.
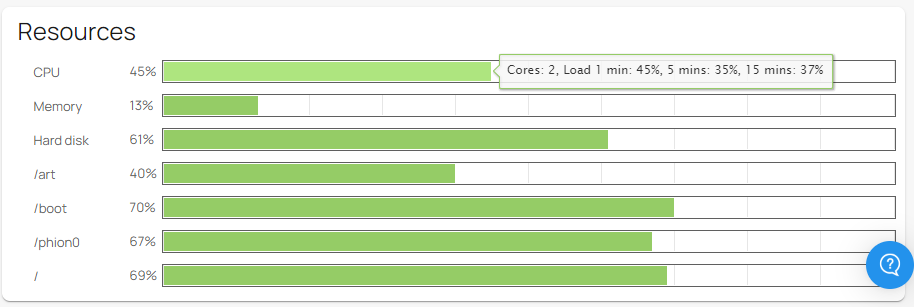
- Resources – The Resources element provides information on the overall real-time usage of your system's resources. This element displays, as a percentage, the system load (CPU Load) and the amount of RAM (memory usage) used and still available. Hover over each resource to see the exact figures for used and available system resources. The following information is provided:
- CPU – Displays the current CPU load of the connected site.
- Memory – Displays the real-time usage of RAM.
- Hard disk – Displays the real-time usage of all currently mounted file systems.
- /art – Directory for basic system configurations and recovery operations. Displays the used and available ART disk space.
- /boot – Directory for boot images. Displays the used and available boot disk space.
- /phion0 – Directory for logs and statistical data. Displays the used and available space.
- / – Root directory. Displays the used and available space.
- VPN Tunnels – The VPN Tunnels element displays the status of all VPN tunnels connected to your sites.
Accessing Information on the IoT Dashboard
The SecureEdge IoT dashboard provides aggregated data on each element of a connected IoT device.
To access an IoT page, first select your workspace, go to Infrastructure > IoT and click on the arrow icon next to the IoT device you are interested in. The IoT Dashboard page provides the following details:
- Status – The Status element displays the status of a connected IoT device.
- Edge Service – The Edge Service element displays information on each connected edge service.
- Firmware – The Firmware element displays the installed software version and provides the time period for next update for your connected IoT device.
- Configuration Updates – The Configuration Updates element displays information on configuration updates for your connected IoT device, such as last update and last seen.
 |
|