

This page displays the tickets created from incidents—alarms and alerts. These tickets include information such as:
- Time created
- Type of incident
- Subject of the ticket
- Impact level of the ticket
- Source IP of incident
- Destination IP
- Ticket Status
- Closure Code
You can find even more information by clicking the ticket to open it.
To find the ticket you're looking for, you can use the filter tools to create criteria that filter out the tickets you don't want to see. You can create criteria based on:
- Dates
- Keywords
- Type: Alerts, alarms, or both
- Status: Open, on hold, closed, or all
- Impact: High, medium, low, or all
You can combine some or all of these criteria, and they will all be applied to focus the tickets list.
Filters are active until you remove them, even if you navigate to another page. When you return to the dashboard, the filter will still be in place.
Raw Events
The Raw Event field shows information on the event that triggered the incident, in an unprocessed state. This data will be in its raw format or protocol, whether that is xml, json, or syslog.
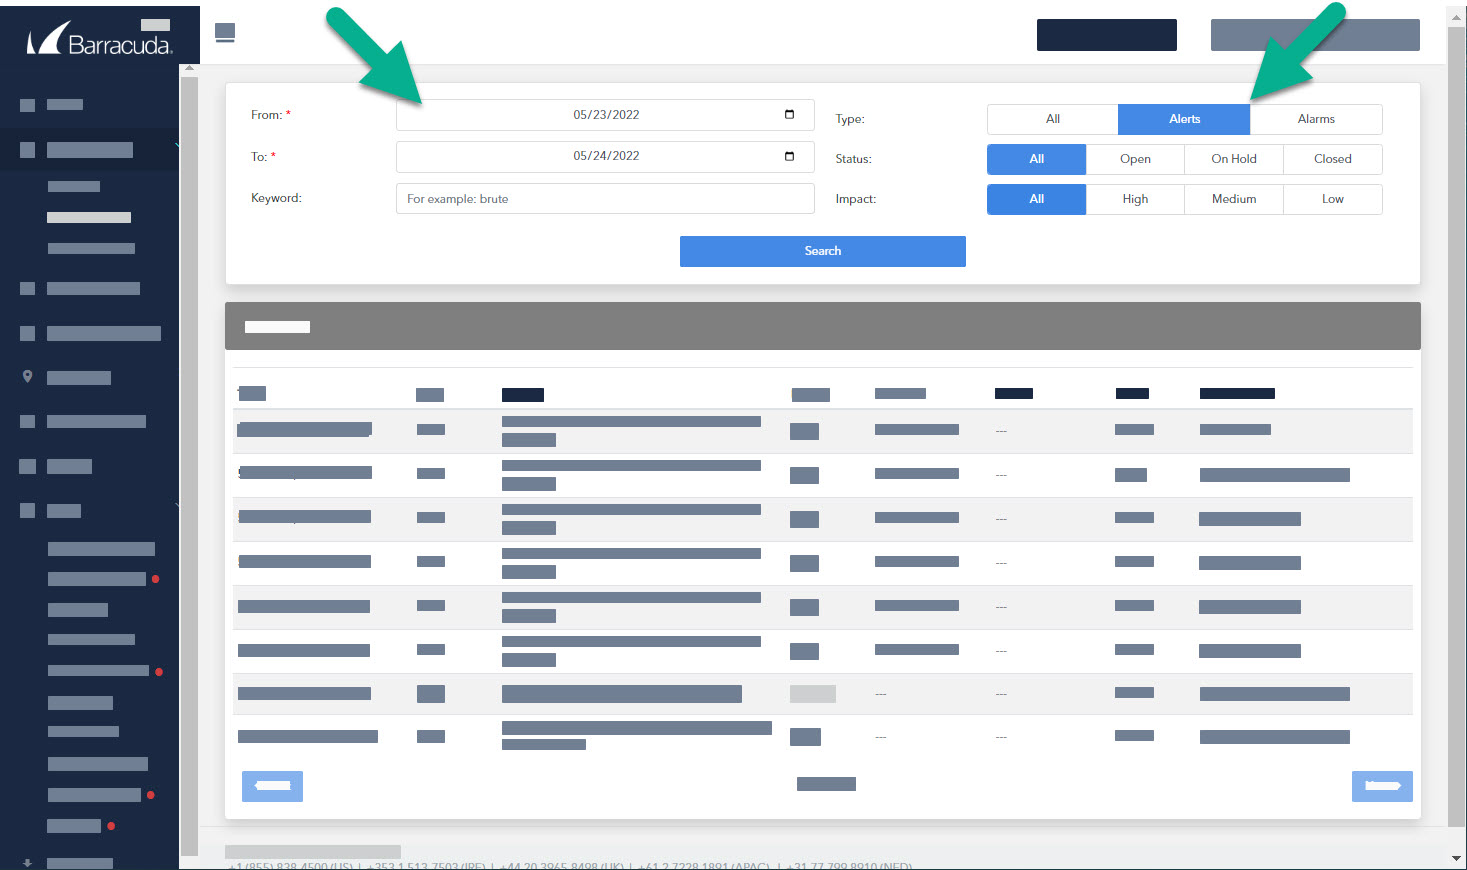
To filter the list of tickets
- In Barracuda XDR Dashboard, click Intelligence > Alarms & Alerts.
- In the From box, select a date.
- In the To box, select a date
- Do any of the following:
- In the Type area, click All, Alerts, or Alarms.
- In the Status area, click All, Open, On Hold, or Closed.
- In the Impact area, click All, High, Medium, or Low.
- Click Search.